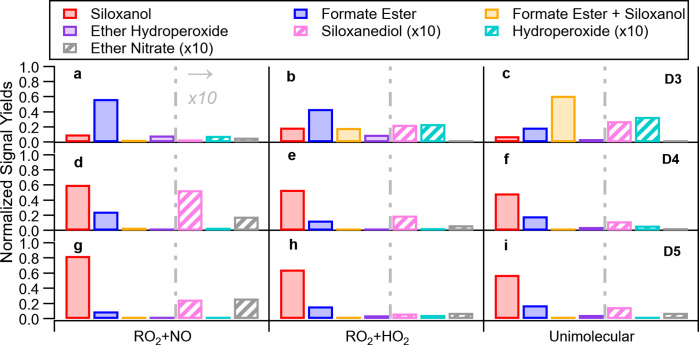
Figure 3.
Signal yield of different cVMS oxidation products when RO2 was most likely to react with (a, d, g) NO, (b, e, h) HO2, or (c, f, i) when unimolecular reactions are favored, divided by the signal of the siloxane lost at that point. Panels (a–c) are for D3, (d–f) for D4, and (g–i) for D5 oxidation. The signals for siloxanediol, ether hydroperoxide, and ether nitrate are multiplied by 10 and striped for visual clarity.

