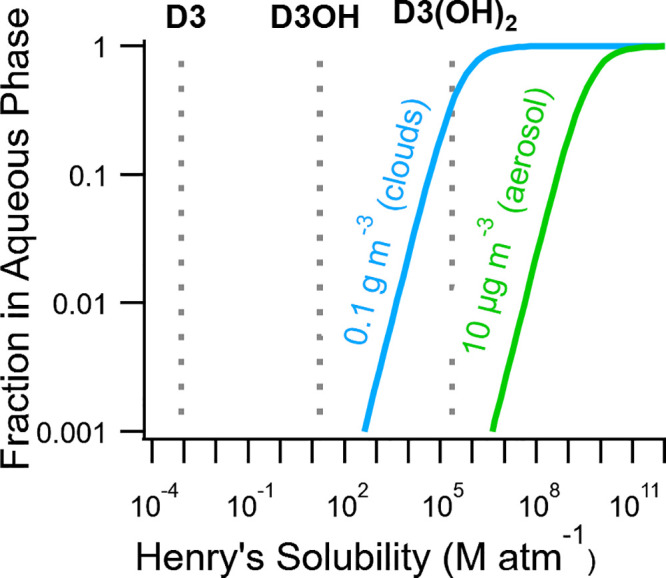
Figure 5.

Estimated Henry’s solubility, estimated with HenryWIN v3.21, for D3 and the siloxanol oxidation products (dashed lines). The mass concentration labels on the solid lines correspond to the amount of liquid water in clouds or ambient aerosol. Only siloxanol products are shown as the hydroxyl groups change the Henry’s solubility most significantly. Larger cVMS oxidation products are estimated to have lower Henry’s solubility than D3. All values are listed in Table S6 of the Supporting Information. Adapted with permission from Daumit, K. E.; Carrasquillo, A. J.; Hunter, J. F.; Kroll, J. H. Laboratory Studies of the Aqueous-Phase Oxidation of Polyols: Submicron Particles vs Bulk Aqueous Solution. Atmos. Chem. Phys. 2014, 14 (19), 10773–10784. https://doi.org/10.5194/acp-14-10773-2014.
