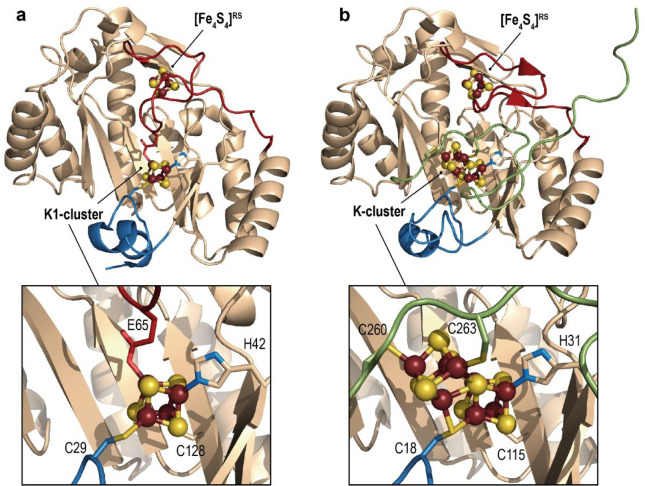
Figure 16.
Crystal structures of the available NifB structures containing (a) the RS- and K1-clusters (PDB 6Y1X(29)) and (b) the RS- and proposed K-clusters (PDB 7BI7(30)). In (a) and (b), the overall protein is shown as peach ribbons, except for the plug loop (see main text), and N-terminal and C-terminal domains are colored in red, blue, and green, respectively. A zoom in of the K1- and K-clusters is shown with the corresponding residues that are ligands. The [FeS] clusters are shown as balls and sticks, and their ligands as sticks. Fe, N, C, O, and S are colored in dark red, blue, peach, red, and yellow, respectively.

