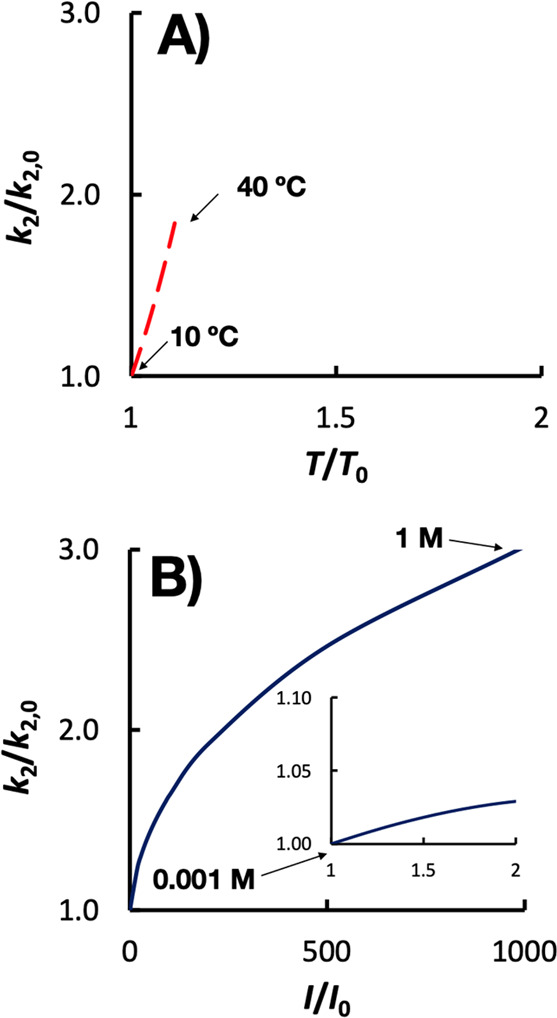
Figure 3.

Relative change in bimolecular rate constant (k2) as a function of the relative change in A) temperature (T) or B) ionic strength (I). Note the difference in scale of the x axis. The temperature dependence calculation assumes an activation energy of 15 kJ/mol, which is typical for radical reactions. The ionic strength dependence calculation assumes that ZAZB = 1 as this would cause an increase in k2 with increasing ionic strength. The inset in (B) has the same axes labels as the outer figure.
