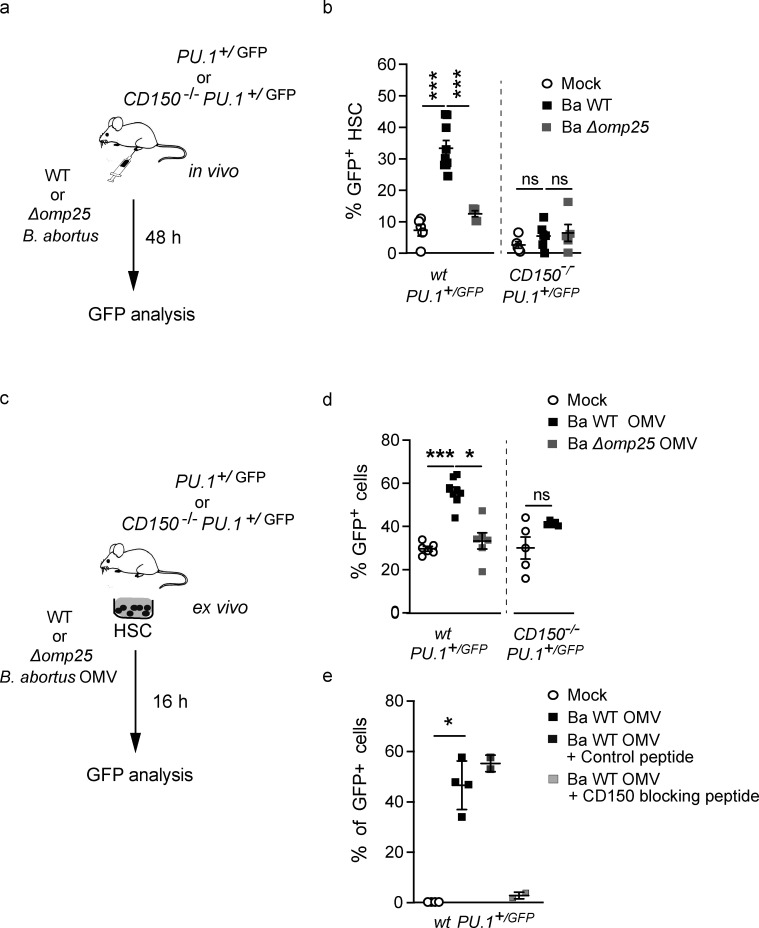
Figure 2.
B. abortus induces PU.1 upregulation in an Omp25/CD150-dependent manner. (a) Experimental scheme: Pu.1+/GFP and CD150−/− Pu.1+/GFP mice were intraperitoneally injected with PBS (Mock, unfilled circle) or inoculated with 1 × 10⁶ CFU of Ba WT (black square), Ba ∆omp25 (gray square). 2 d later, the percentage of GFP expression in HSC (lin−, Sca+, cKit+, CD48−, CD135− CD34−) was assessed by flow cytometry. (b) GFP expression in BM HSC (lin−, Sca+, cKit+, CD48−, CD135−, CD34−) assessed by flow cytometry at day 2 after infection. Data (b) were obtained from distinct samples (from left to right, n = 5, 10, 5, 5, 6) from three independent experiments. Mean ± SD is represented by a horizontal bar. Significant differences from mock are shown. ***, P < 0.001; * P < 0.05. Absence of P value or ns, non-significant. Since data did not follow a normal distribution, P values were generated using Kruskal–Wallis followed by Dunn’s test. (c) Experimental scheme: HSC (lin−, Sca+, cKit+, CD48−, CD135−, CD34−) from Pu.1+/GFP or CD150−/− Pu.1+/GFP mice were sorted, then stimulated ex vivo with PBS or B. abortus WT OMVs, B. abortus ∆omp25 OMVs. After 16 h, the level of GFP in cells was assessed by flow cytometry. (d) Percentage of GFP + HSC 16 h after ex vivo stimulation with B. abortus WT OMV (black square), B. abortus ∆omp25 OMV (gray square) compared to mock (Mock, unfilled circle) assessed by flow cytometry (from left to right: n = 6, 6, 6, 5, 5). (e) Percentage of GFP+ HSC assessed by flow cytometry 0 h (Mock, unfilled circle, n = 4) or 16 h after ex vivo stimulation with B. abortus WT (black square, n = 4), B. abortus WT OMV and the control peptide (100 µg/ml; black square, n = 2), and blocking peptide of CD150 (100 µg/ml; gray square, n = 2). Data (d and e) were obtained from HSC of a pool of three to four mice, and the pool of cells has been divided by the number of tested conditions. Each dot is a replicative experiment. Mean ± SD is represented by a horizontal bar. Significant differences from mock are shown. **, P < 0.01; *, P < 0.05. P values were generated using Mann–Whitney test.

