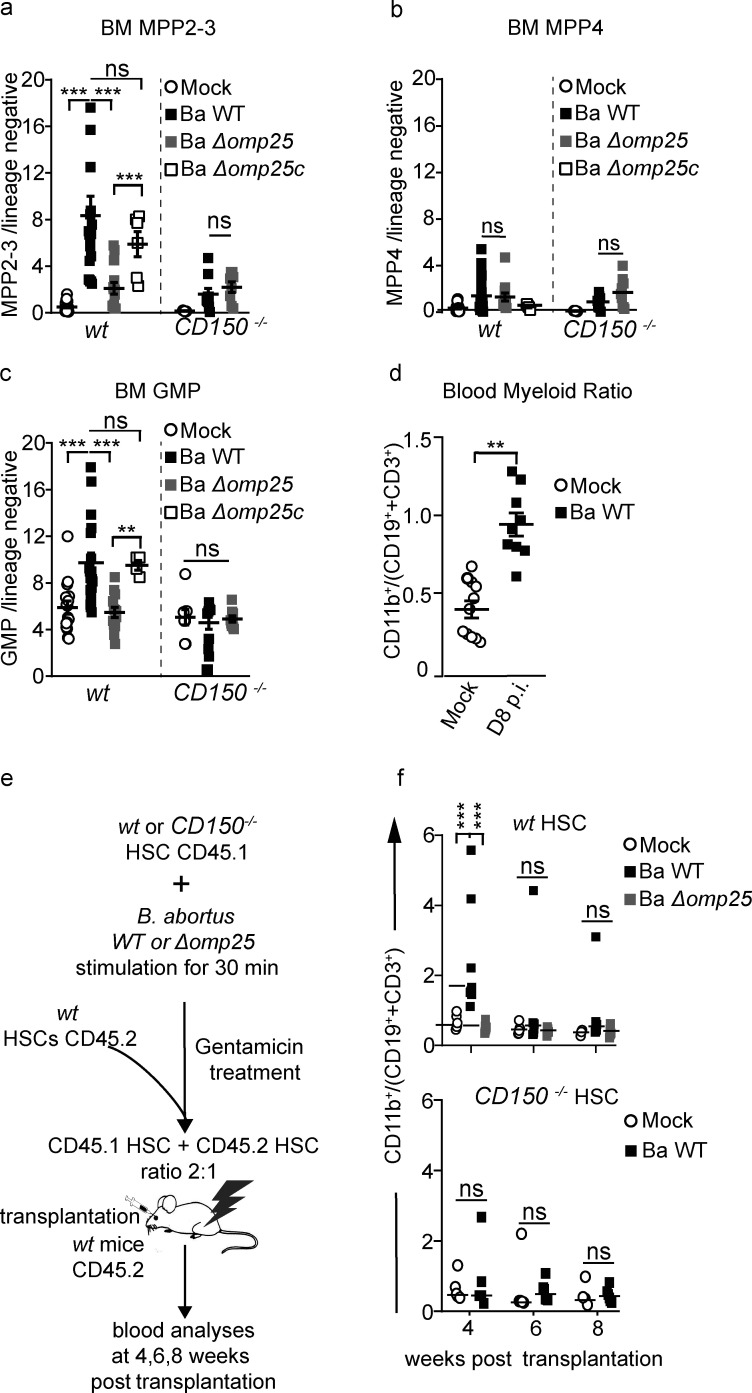
Figure 3.
B. abortus induces HSC differentiation towards myeloid lineage. (a–d) C57BL/6J wt and CD150−/− mice were intraperitoneally inoculated with 1 × 10⁶ B. abortus CFU. 8 d later, FACS analyses were performed for BM cells. Frequency of (a) MPP2-3 (lin−, Sca+, cKit+ CD48+, CD135−; from left to right: n = 22, 19, 14, 6, 11, 9, 8); (b) MPP4 (lin−, Sca+, cKit+, CD48+, CD135+; from left to right: n = 22, 21, 12, 4, 9, 9, 9); (c) GMP (lin−, Sca−, cKit+, CD34+, CD16/32+; from left to right: n = 16, 18, 13, 4, 8, 9, 9) in lin− BM cells is shown for mice injected with PBS (Mock, unfilled circle) or inoculated with 1 × 10⁶ CFU of Ba WT (black square), B. abortus ∆omp25 (Ba ∆omp25; gray square), or B. abortus ∆omp25 complemented with p:Omp25 (Ba ∆omp25c; unfilled square) mutants (the latter only for wt mice). (d) 8 d after infection, myeloid cells (CD45+, CD11b+) to lymphoid cells (CD45+, CD3e+; and CD45+, CD19+) ratio in blood is shown for mice injected with PBS (Mock; unfilled circle; n = 11) or inoculated with 1 × 10⁶ CFU of Ba WT (black square; n = 9). (e) Experimental scheme: HSC from wt CD45.1 and CD150−/− CD45.1 mice were sorted and then incubated ex vivo with Ba WT or Ba ∆omp25 for 30 min. After 30 min, cells were washed and treated for 1 h with gentamycin to kill extracellular bacteria. HSC were then transplanted into lethally irradiated wt CD45.2 recipients in competition with the CD45.2 competitor in a ratio of 2:1. FACS analyses of blood samples were performed at 4, 6, and 8 wk after transplantation. (f) Myeloid cells (CD45+, CD11b+) to lymphoid cells (CD45+, CD3e+; and CD45+, CD19+) ratio in CD45.1+ blood cells is shown for hematopoietic cells provided by CD45.1+ wt mice (upper panel) or CD150−/− mice (lower panel), non-infected (Mock, unfilled circle) or infected with 1 × 10⁶ CFU of Ba WT (black circle), Ba ∆omp25 (gray circle) as described in panel e (from left to right: for WT, n = 12, 13, 10, 10, 9, 9, 12, 8, 8; and for CD150−/−, n = 9, 4, 14, 8, 11, 7). Data were obtained from distinct samples from four independent experiments (a–d) or from repetitive sampling from two independent experiments (e and f). Mean ± SEM is represented by a horizontal bar. Significant differences from mock are shown. ***, P < 0.001; **, P < 0.01. Absence of P value or ns, non-significant. Since data did not follow a normal distribution, P values were generated using Kruskal–Wallis followed by Dunn’s test.

