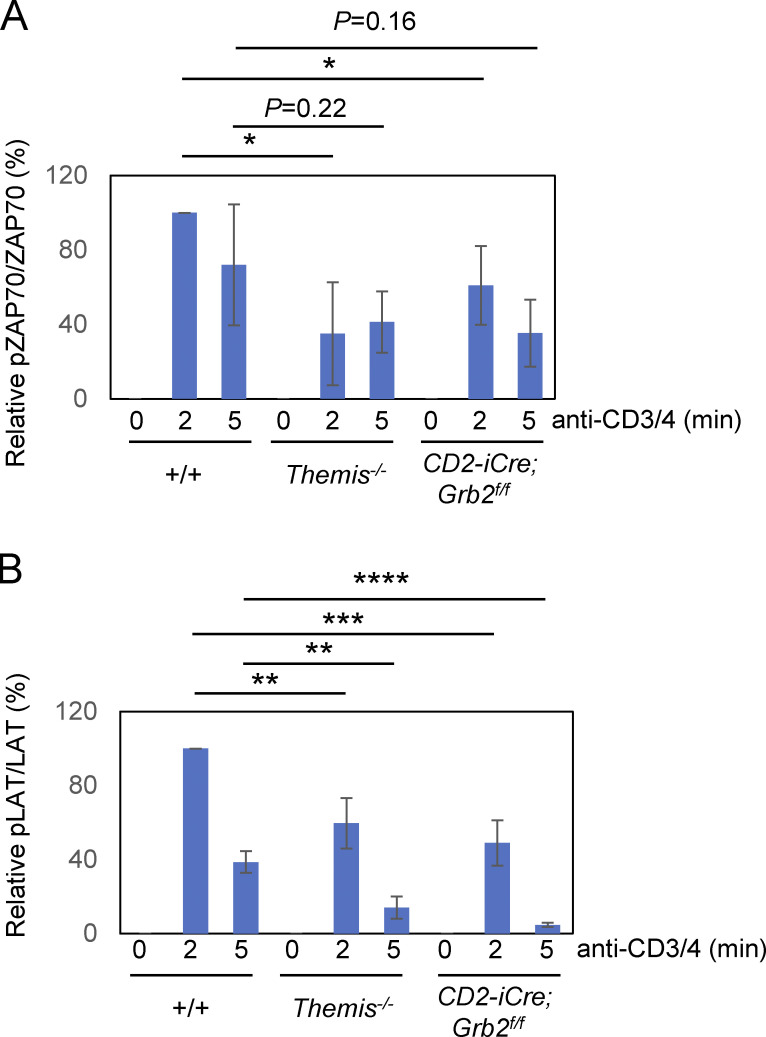
Figure S1.
Quantitation of pZAP-70 bands and pLAT bands from three experiments as shown in Fig. 2 B. Bands were quantitated by densitometry relative to total ZAP-70 (A) or LAT (B) bands, respectively, for each time point. The value for +/+ at 2 min was arbitrarily set at 100% and all results are shown relative to that. Error bars show SD. *P < 0.05, **P < 0.01, ***P < 0.005, ****P < 0.001. T test, two tailed, Type 2.

