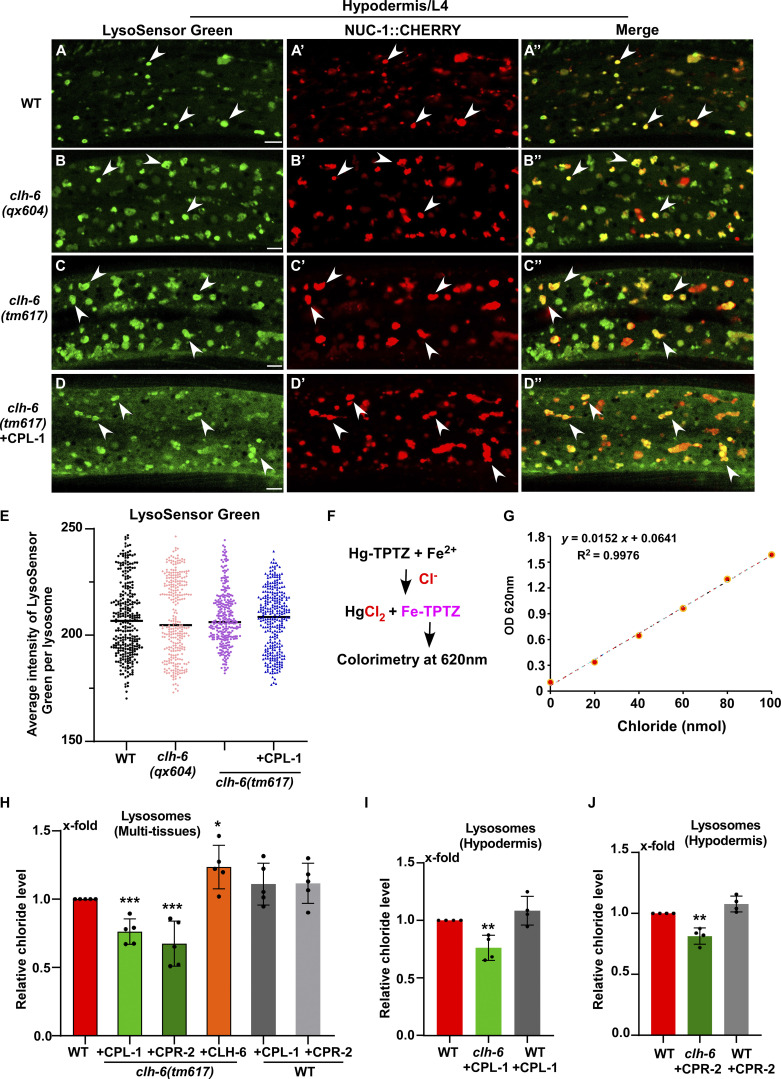
Figure 7.
Lysosome chloride level, but not acidity, is affected in clh-6 mutants. (A–D′′) Confocal fluorescence images of the hypodermis in the indicated strains expressing NUC-1::CHERRY and stained by LysoSensor green. Intact lysosomes indicated by strong NUC-1::CHERRY fluorescence were scored and they were well stained by LysoSensor green (white arrowheads). (E) The mean intensity of LysoSensor green per lysosome is quantified in E. 300 lysosomes in 6–7 worms were scored in each strain. Scale bars: 5 µm. (F–J) Chloride concentration is determined by a competition reaction (F). The standard curve (G) and lysosomal chloride concentration in multi-tissues (H) and hypodermis (I and J) were determined as described in the Materials and methods. Relative chloride levels are presented. At least four independent experiments were performed. Data are shown as mean ± SD. In E and H–J, unpaired two-tailed Student’s t test was performed to compare mutant datasets with wild type. **P < 0.001, *P < 0.05, ***P < 0.0001. All other points had P > 0.5.

