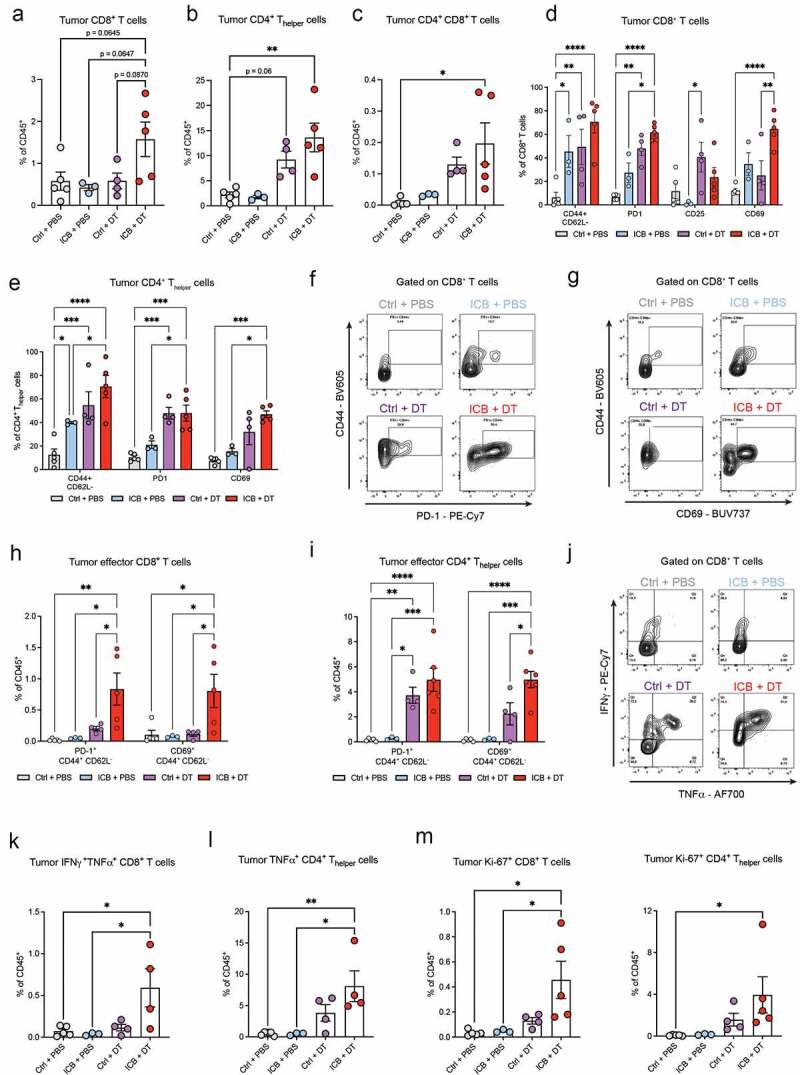
Figure 3.

Increased tumor infiltration and activation of T cells upon depletion of Tregs during neoadjuvant ICB.
(A-C) Frequency of CD8+ T cells (A), CD4+ Thelper cells (B), and CD4+CD8+ double-positive T cells (C) in resected tumors of mice treated as indicated, determined by flow cytometry (n=3-5). (D-E) Frequency of indicated activation markers (% of positive cells) gated on CD8+ T cells (D) or CD4+ Thelper cells (E) in resected tumor of mice treated as indicated, determined by flow cytometry (n=5-8). (F-G) Representative contour plots depicting co-expression of PD-1 and CD44 (F) or CD69 and CD44 (G) on CD8+ T cells in resected tumors of mice treated as indicated. (H-I) Frequency of CD44+CD62L− effector CD8+ (H) and CD4+ (I) T cells co-expressing PD-1 or CD69 in the tumors of mice treated as indicated, analyzed by flow cytometry (n=3-5). (J) Representative contour plots depicting IFNγ- and TNFα-production by tumor CD8+ T cells in resected tumors of mice treated as indicated. (K-L) Frequency of IFNγ+TNFα+ CD8+ T cells (K) and TNFα+ CD4+ T cells (L) as % of CD45+ cells in the tumor of mice treated as indicated, measured by intracellular flow cytometry after ex vivo PMA/ionomycin stimulation (n=3-5). (M) Frequency of Ki-67+ CD8+ and CD4+ T cells as % of CD45+ cells in the tumors of mice treated as indicated, analyzed by intracellular flow cytometry (n=3-5). Data in A-E,H-I,K-M show mean ± SEM. P-values were calculated by One-way ANOVA with Sidak’s correction (A-C,K-M) or Two-way ANOVA with Sidak’s correction (D-E,H-I). ns, not significant, * P < 0.05, ** P < 0.01, *** P < 0.001, **** P < 0.0001.
