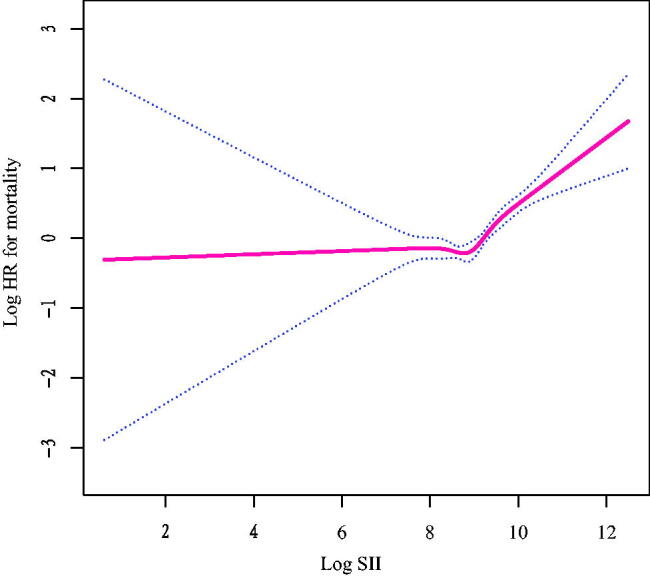
Figure 3.

Relationship between log2-SII and all-cause mortality by smooth curve fitting. Adjustment for age, sex, race, BMI, waist circumference, marital status, education, smoking and family poverty income ratio, asthma, cancer, diabetes; hypertension, smoking, creatinine, cholesterol, ALT, AST, HbA1c, HDL and creatinine. The red line demonstrates the risk of mortality, and the blue dotted lines illustrate its 95% confidence interval.
