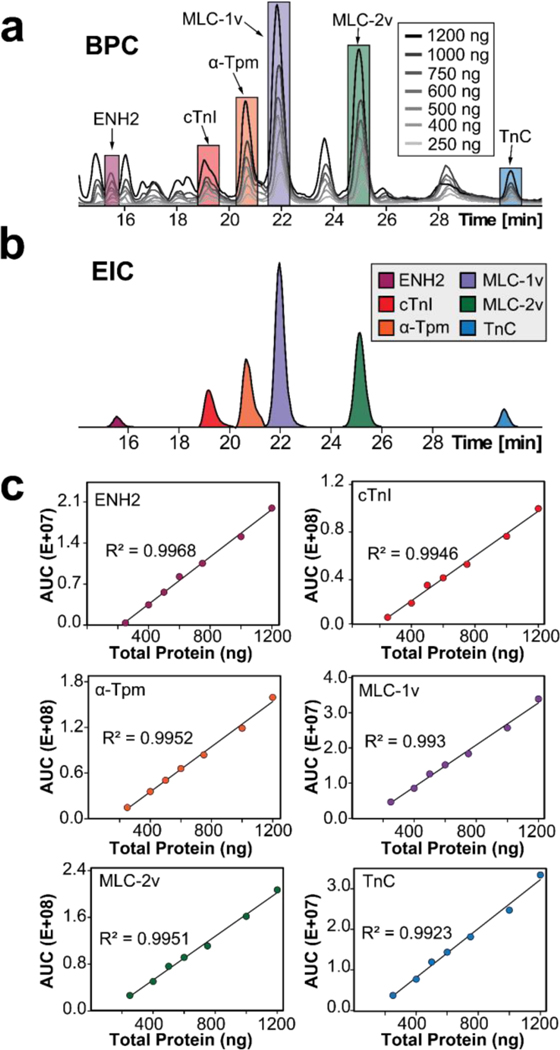
Figure 3. Mutual linear range response determination for key sarcomeric proteins.
(a) Overlaid BPCs of 250, 400, 500, 600, 750, 1000, and 1200 ng of total protein loaded into the LC-MS demonstrating highly similar proteoform profiles. (b) EICs were generated for ENH2, cTnI, α-Tpm, MLC-1v, MLC-2v, and TnC by combining the top 3–5 most abundant charge states of all proteoforms of the same protein. (c) Mutual linear range response determination for key sarcomeric proteins. AUCs of the individual sarcomeric proteins exhibit mutual linear correlation with 250–1200 ng of total protein injected with 3 injection replicates for each point.

