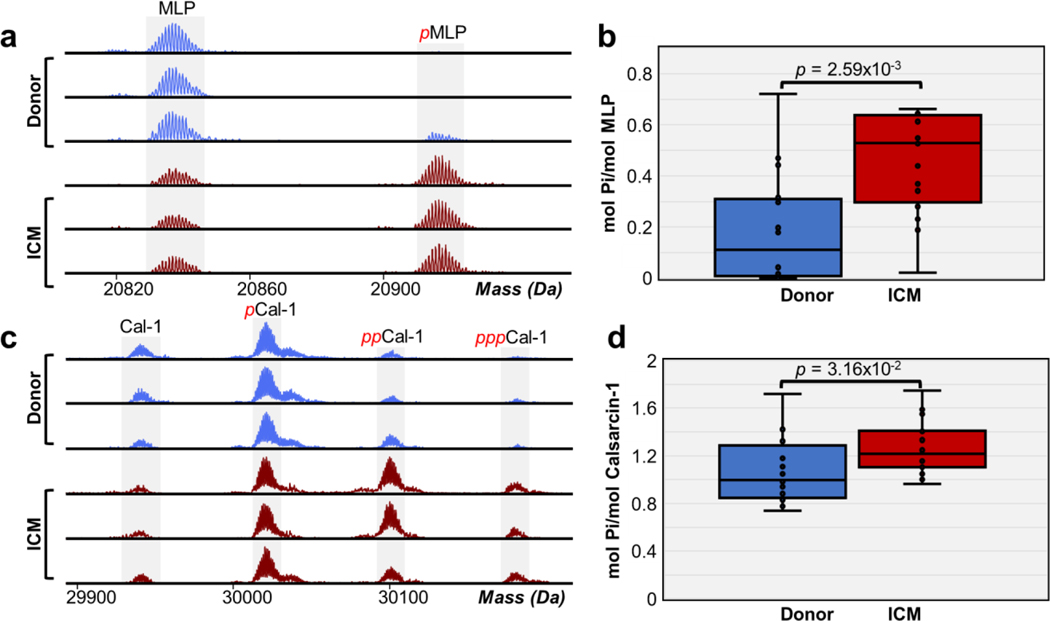
Figure 6. Increase in MLP and calsarcin-1 phosphorylation in ICM.
(a) Representative high-resolution deconvoluted spectra of MLP in non-failing donor (blue) compared to ICM (red) tissues. Red p denotes monophosphorylated MLP. (b) Total protein phosphorylation calculated by mol pi/mol protein for MLP. Box, median and interquartile range (25%, 75%); whiskers, minimum and maximum values. Horizontal lines represent the median of the group. Groups were considered significantly different by paired-student t tests with p < 0.01. (c) Representative high-resolution deconvoluted spectra of calsarcin-1 (Cal-1) in non-failing donor (blue) compared to ICM (red) tissues. Red p, pp, and ppp denotes mono-, bis-, and tris-phosphorylated proteoforms, respectively. (d) Total protein phosphorylation calculated by mol pi/mol protein for calsarcin-1. Box, median and interquartile range (25%, 75%); whiskers, minimum and maximum values. Horizontal lines represent the median of the group. Groups were considered significantly different by paired-student t tests with p < 0.05.

