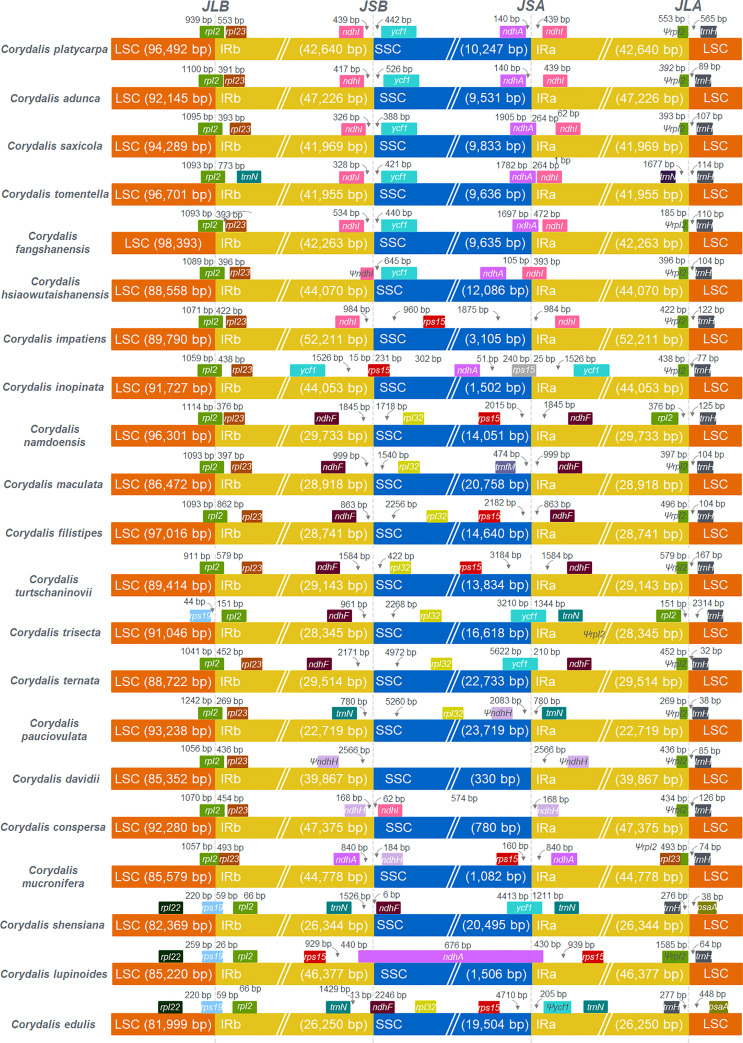
Figure 3.
Comparison of the borders of LSC, SSC, and IR regions among 21 Corydalis chloroplast genomes. JLB indicates the junction line between LSC and IRb; JSB indicates the junction line between SSC and IRb; JSA indicates the junction line between SSC and IRa; JLA indicates the junction between LSC and IRa.

