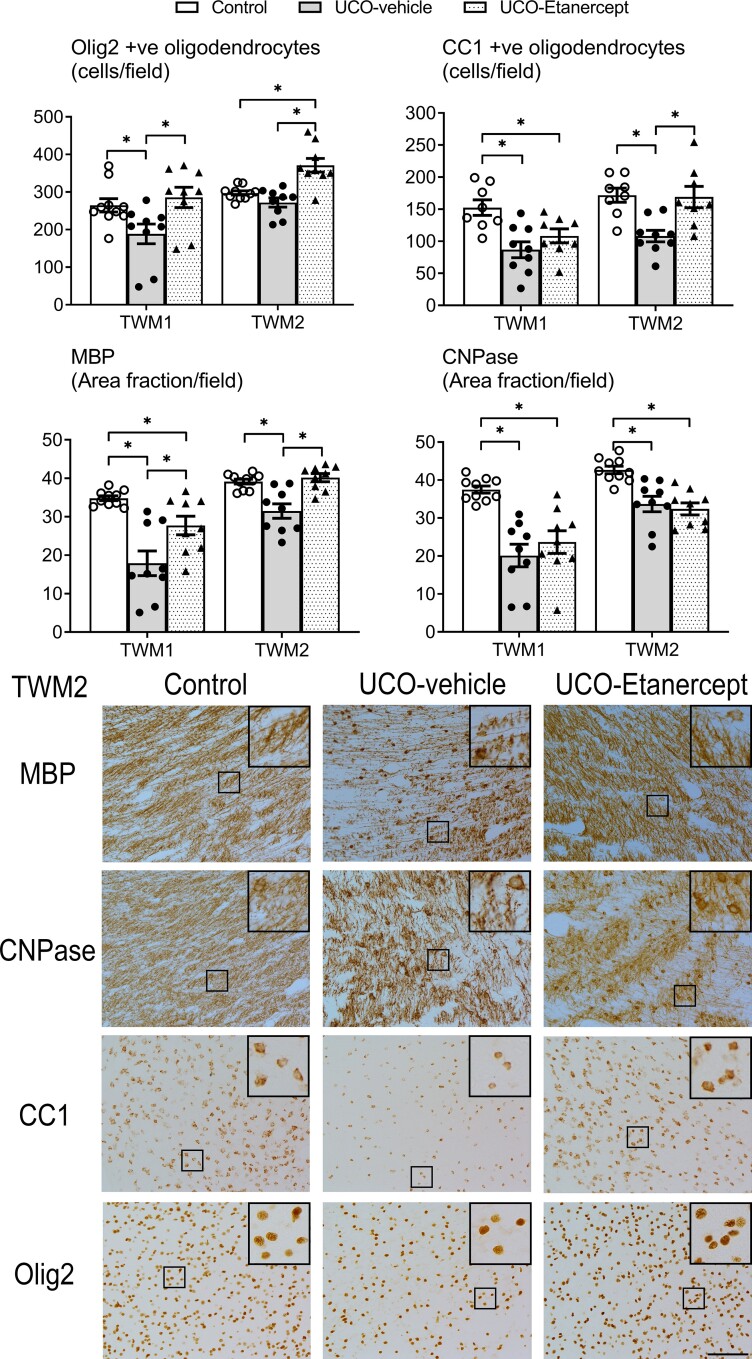
Figure 2.
Temporal lobe WMI. Top panels show the numbers of total (Olig-2) and mature (CC1) oligodendrocytes and the area fractions of two myelin proteins (MBP and CNPase) in the TWM regions (TWM1 and TWM2). Asterisk denotes significant difference of P < 0.05 between the two groups indicated. Data are means ± SEM. Bottom panels show the representative photomicrographs of MBP-positive and CNPase-positive labelling and total (Olig2) and mature (CC1) oligodendrocytes in the TWM2 region. Note the sparse labelling of myelin proteins with abnormal morphology in the UCO-vehicle group. Improved myelin protein morphology is observed in the UCO-Etanercept group, more closely resembling that observed in the control group. All images were taken at ×20 magnification, insets are ×3 enlargements. Scale bar = 100 µm.

