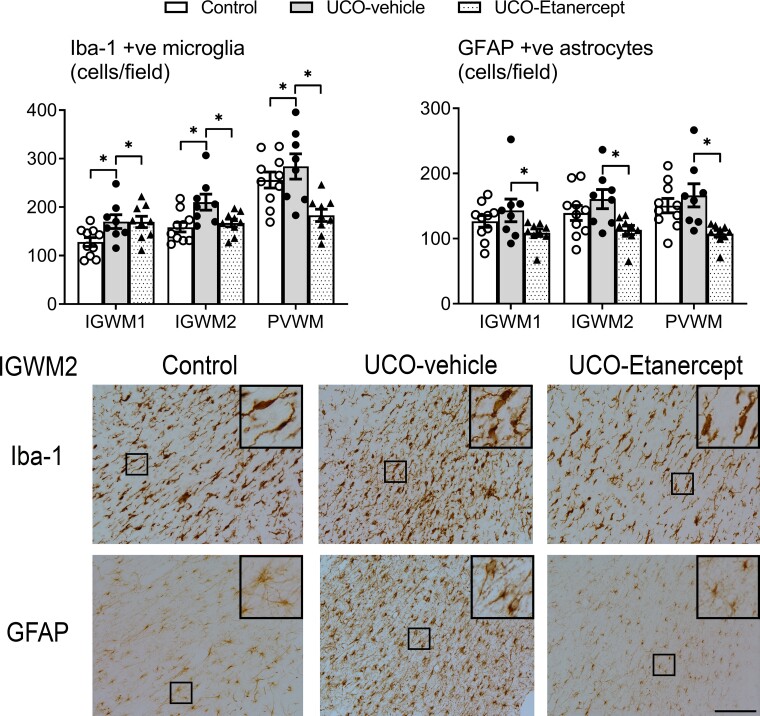
Figure 5.
Parietal lobe white matter neuroinflammation. Top panels show the numbers of microglia (Iba-1) and astrocytes (GFAP) in the parietal white matter regions (IGWM1/2 and PVWM). Asterisk denotes significant difference of P < 0.05 between the two groups indicated. Data are means ± SEM. Bottom panels show the representative photomicrographs of Iba-1-positive microglia and GFAP-positive astrocytes in the IGWM2 region. Note the profound reduction in both microglia and astrocyte density in the UCO-Etanercept group back to control levels. Micrographs also display a similar proportion of ramified to amoeboid microglia morphology between UCO-Etanercept and the control group. All images were taken at ×20 magnification, insets are ×3 enlargements. Scale bar = 100 µm.

