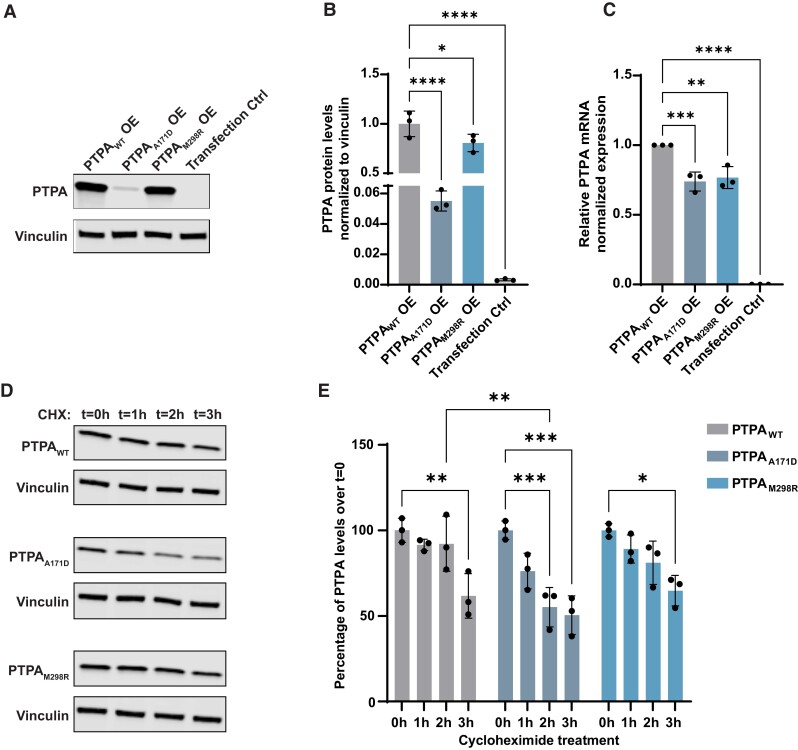
Figure 2.
Comparison of protein and RNA levels of wild-type PTPA and the identified PTPA variants p.Ala171Asp PTPA and p.Met298Arg PTPA in cultured cells. (A) Representative western blot of protein extracts from cultured cells transfected with wild-type PTPA (PTPAWT), p.Ala171Asp PTPA (PTPAA171D), p.Met298Arg PTPA (PTPAM298R) and empty vector (Transfection Ctrl). Blots were probed for expression of PTPA and vinculin. (B) Quantification showing a significant decrease in PTPA levels in p.Ala171Asp and p.Met298Arg PTPA-expressing cells (n = 3). Mean (SD); PTPAWT: 1.00 (0.13); PTPAA171D: 0.06 (0.01); PTPAM298R: 0.81 (0.09); transfection control: 0.00 (0.00). (C) RT-qPCR analysis of PTPA in transfected cells, showing a significant decrease in PTPA expression in PTPAA171D, PTPAM298R and empty vector-expressing cells. Data represent relative normalized expression of PTPA mRNA. CLK2 and COPS5 were used as reference genes (n = 3). Mean (SD); PTPAWT: 1.00 (0.00); PTPAA171D: 0.74 (0.07); PTPAM298R: 0.77 (0.08); transfection control: 0.00 (0.00). (D) Representative western blot of PTPA in transfected cells treated with cycloheximide (CHX) for the indicated times. (E) Quantification of PTPA over cycloheximide treatment, showing a significant decrease in PTPAA171D compared to PTPAWT 2 h after treatment, indicating protein instability. The bars indicate mean PTPA levels per time point as percentage of cells treated at time = 0 h (n = 3). Error bars represent ± SD. Only significant changes *P < 0.05, **P < 0.01, ***P < 0.001 and ****P < 0.0001 are shown.

