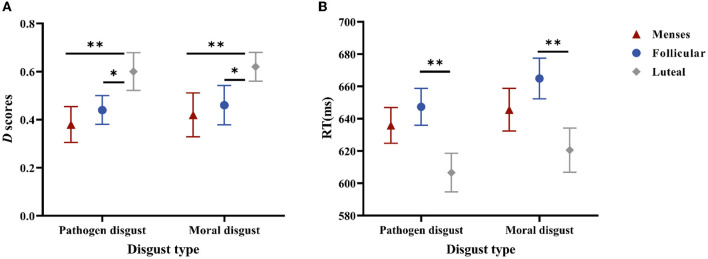
Figure 2.
Performances in the SC-IAT. (A) is the D scores for women as a function of disgust type * cycle phase. (B) is the mean RTs of the incongruent and congruent responses for women as a function of disgust type * cycle phase. Error bars represent the standard error of the mean. **p < 0.01; *p < 0.05.

