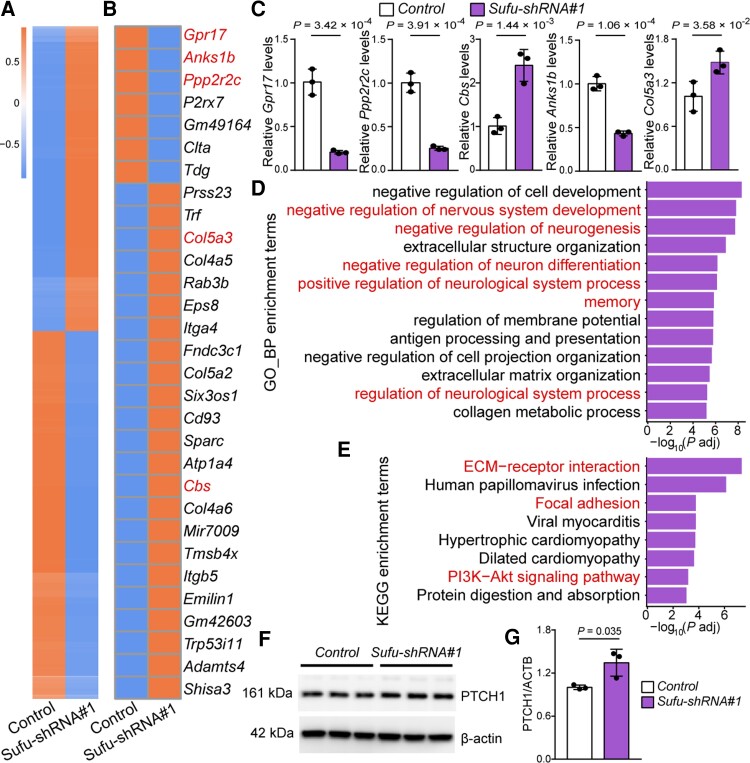
Figure 5.
Sufu regulates SCZ-associated biological processes and signalling pathways. (A) Expression heat map of 860 DEGs identified in Sufu knockdown mNSCs compared with control mNSCs. (B) Heat map plot of the top 30 DEGs. Five genes (marked by red colour), including Gpr17, Anks1b, Ppp2r2s, Col5a3 and Cbs, were selected for qPCR verification (C). (D) GO analysis based on biological process for the 860 DEGs. Terms marked in red indicate schizophrenia-associated biological processes. (E) KEGG analysis of the 860 DEGs. Terms marked in red indicate schizophrenia-associated signalling pathways. (F, G) Validation of PTCH1 expression in Sufu knockdown mNSCs with Western blot. n = 3 for C and G; unpaired two-tailed Student’s t-test; data are presented as mean ± SD.

