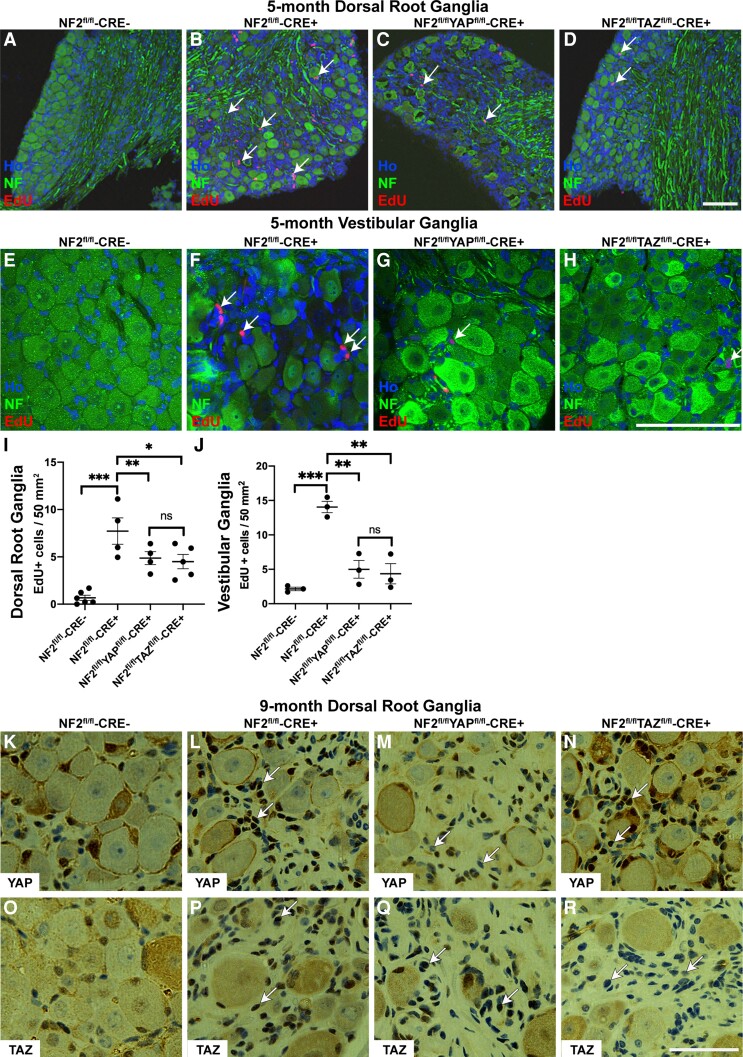
Figure 1.
Proliferation of schwannoma cells in the DRG and VG is dependent upon both YAP and TAZ proteins. (A–H) Images of DRG (A–D) and VG (E–H) from 5-month-old mice stained for EdU and neurofilament (NF); sections were counterstained with Hoechst to reveal nuclei (Ho). Arrows indicate EdU-positive nuclei in the areas of the ganglia in close proximity to the neuronal cell bodies; note fewer proliferating cells in NF2/YAP (C and G) and NF2/TAZ (D and H) than in NF2 single null (B and F) ganglia. (I and J) Quantification of EdU-positive cells per area of ganglion tissue of DRG (I) and VG (J). Note significant decreases in proliferation in both NF2/YAP and NF2/TAZ ganglia. (K–R) Staining of DRG sections from 9-month-old control (NF2fl/flCRE-; K and O), NF2 single null (NF2fl/flCRE+; L and P), NF2/YAP double null (NF2fl/fl/YAPfl/flCRE+; M and Q) and NF2/TAZ double null (NF2fl/fl/TAZfl/flCRE+; N and R) animals. Panels K–N show staining with YAP antibody; panels O–R with TAZ antibody. Note raised nuclear expression of YAP in NF2 single (L; arrows) and NF2/TAZ double (N; arrows) null tissue, which is lost in NF2/YAP double null tissue (M; arrows). For TAZ staining, note raised nuclear TAZ expression in NF2 single (P; arrows) and NF2/YAP double (Q; arrows) null tissue, which is not present in NF2/TAZ double null DRG tissue (R; arrows). A–D and I, n = 4; E–H and J, n = 3; K–R, n = 3 for each genotype examined. Data presented in graphs are means ± SEM using one-way ANOVA with Bonferroni’s multiple comparison tests. *P < 0.05; **P < 0.01; ***P < 0.001; ns, not significant. Scale bars = A–H 75 μm, K–R 50 μm.

