Figure 3.
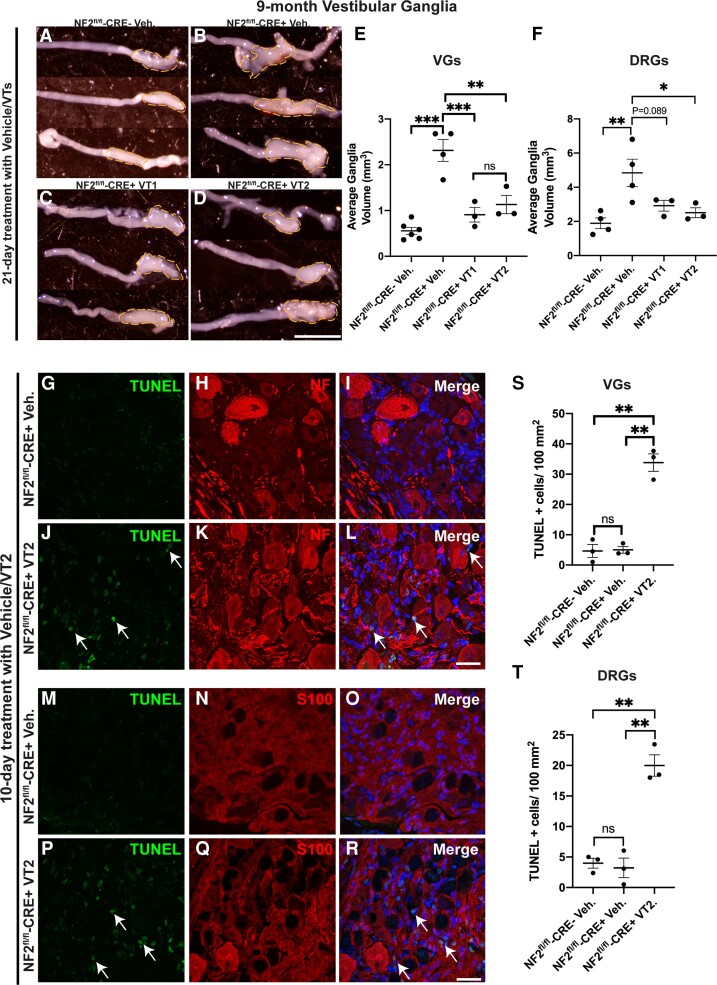
Treatment of mice with VT auto-palmitoylation inhibitors significantly increases apoptosis and reduces tumour volumes in VG and DRG in 9-month-old NF2fl/fl-CRE+ (NF2fl/fl-CRE+) mice. NF2fl/fl-CRE- (NF2fl/fl-CRE-) and NF2fl/fl-CRE+ animals were treated with vehicle (Veh), 10 mg/kg/day VT1 or 30 mg/kg/day VT2 by oral gavage for 10 or 21 consecutive days. (A–D) Representative brightfield micrographs of three different unilateral VG from: NF2fl/fl-CRE- Veh-treated mice (A), NF2fl/fl-CRE+ Veh-treated mice (B), NF2fl/fl-CRE+ VT1-treated mice (C) and NF2fl/fl-CRE+ VT2-treated mice (D), all mice were treated for 21 consecutive days. Scale bar = 20 μm. (E) Quantification of average bilateral VG volume in A–D, for NF2fl/fl-CRE- Veh-treated mice (n = 6 ganglia, n = 3 mice), NF2fl/fl-CRE+ Veh-treated mice (n = 4 ganglia, n = 3 mice), NF2fl/fl-CRE+ VT1-treated mice (n = 3 ganglia, n = 3 mice) and NF2fl/fl-CRE+ VT2-treated mice (n = 3 ganglia, n = 3 mice). (F) Quantification of average bilateral lumbar 4 DRG volume, for NF2fl/fl-CRE- and NF2fl/fl-CRE+ Veh-treated mice (n = 8 ganglia, n = 3 mice), for NF2fl/fl-CRE+ VT1- and NF2fl/fl-CRE+ VT2-treated mice (n = 3 ganglia, n = 3 mice). (G–R) Representative immunofluorescence of n = 3 different VGs with in situ apoptosis detected by terminal deoxynucleotidyl transferase dUTP nick-end labelling (TUNEL) assay, following oral gavage with either vehicle or 30 mg/kg/day VT2 for 10 days. TUNEL+ nuclei (arrows; J, L, P and R) were significantly increased in NF2fl/fl-CRE+ VT2-treated mice compared to NF2fl/fl-CRE+ Veh-treated mice. Neurofilament (NF; H and K) counterstain (merged with Hoechst counterstain (I and L) reveals increased apoptosis in cells surrounding neuronal cell bodies of the VG in NF2fl/fl-CRE+ VT2-treated mice. S100 counterstain (N and Q merged with Hoechst counterstain (O and R) reveals apoptosis is increased in S100+ schwannoma cells of NF2fl/fl-CRE+ VT2-treated mice. Scale bars = 20 μm. (S and T) Quantification of TUNEL+ cells/100 mm2 in VG (S) and DRG (T). In E and F, data presented as mean ± SEM using one-way ANOVA with Tukey’s multiple comparisons tests. In S and T, data presented as mean ± SEM using Brown–Forsythe and Welch ANOVA with Dunnett’s T3 multiple comparisons test. **P < 0.01; ***P < 0.001; ns = non-significant.

