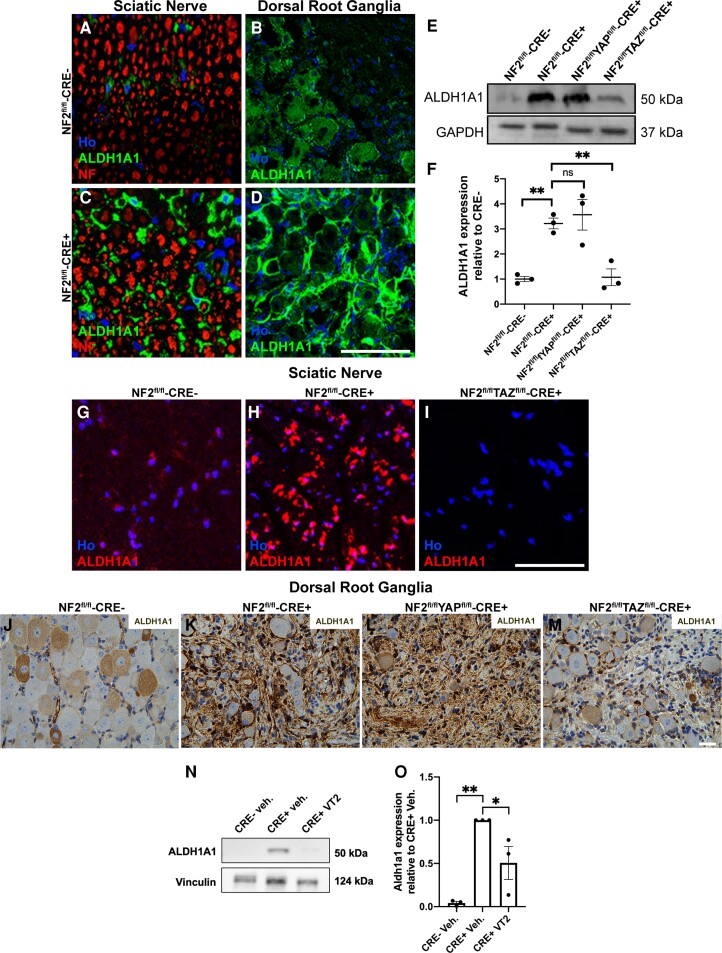
Figure 6.
Expression of ALDH1A1 is TAZ-dependent in mouse Schwann cells and schwannoma tissue. (A–D) Immunolabelling of NF2fl/fl-CRE- (A and B) and NF2fl/flCRE+ (C and D) sciatic nerve (A and C) and dorsal root ganglion (DRG; B and D) tissue showing elevated expression of ALDH1A1 in NF2-null mouse tissue. In sciatic nerve, ALDH1A1 staining appears associated with the non-myelinating Schwann cells. In DRG, high ALDH1A1 expression was seen in the cells surrounding the neuronal cell bodies. (E) Western blot showing raised ALDH1A1 expression in NF2fl/flCRE+ sciatic nerve, which was reduced in NF2fl/flTAZfl/fl-CRE+ but not NF2fl/flYAPfl/fl-CRE+ animals. (F) Quantification of western blot in E. (G–I) Immunolabelling of transverse sections of sciatic nerve, showing elevated ALDH1A1 in NF2fl/fl-CRE+ nerve (H), but reduced in NF2fl/flTAZfl/fl-CRE+ double null nerves (I). (J–M) ALDH1A1 staining of DRG tissue paraffin sections from control NF2fl/fl-CRE- (J), NF2fl/fl-CRE+ (K), NF2fl/flYAPfl/fl-CRE+ (L) and NF2fl/flTAZfl/fl-CRE+ (M) double-null mice. (N and O) Representative western blot (N) and quantification (O) of ALDH1A1 expression in sciatic nerve from NF2fl/fl-CRE- and CRE+ vehicle- or VT2-treated mice. For data presented, n = 3 mice for each genotype and age. Data presented in graphs are means ± SEM. In F, for analysis, a one-way ANOVA with Bonferroni’s correction was used. In O, for analysis, a one-way ANOVA with Tukey’s multiple comparisons correction was used. *P < 0.05, **P < 0.01; ns = not significant. Scale bars in A–D and G–I = 50 μm, J–M = 25 μm.

