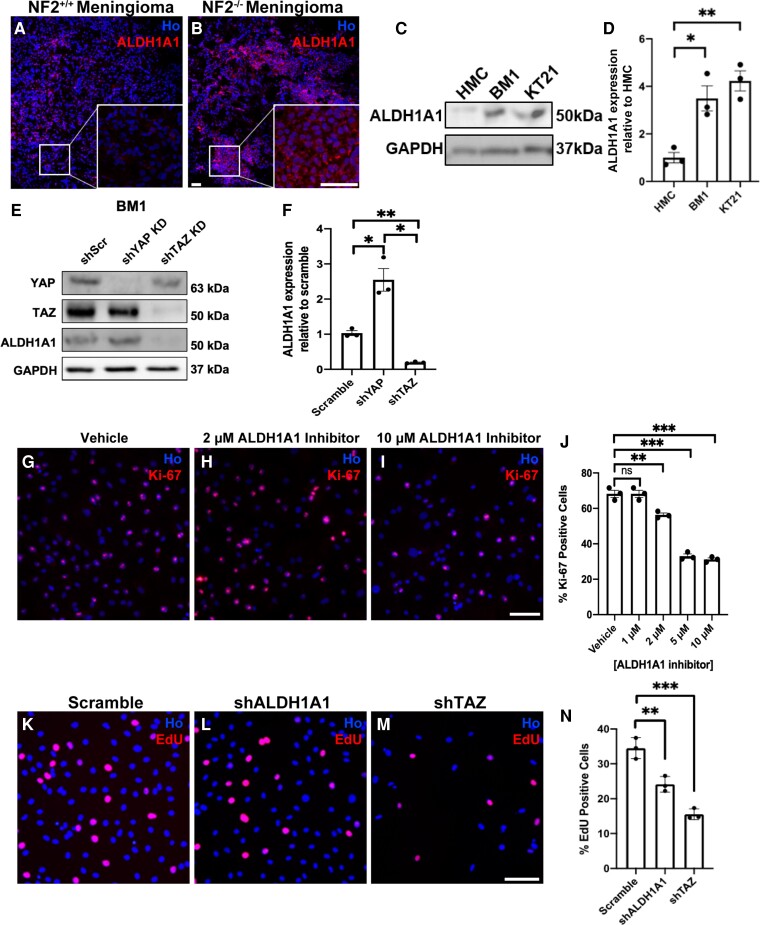
Figure 8.
ALDH1A1 is upregulated in NF2-null human meningioma tissue and cells. (A and B) Staining of sections of NF2-postive (NF2+/+, A) and NF2-null (NF2−/−, B) meningioma tissue shows higher ALDH1A1 in NF2-null tumours. Boxes show enlarged section of the tumour with strong cytoplasmic stain of ALDH1A1 protein. (C) Western blot of control human meningeal cells (HMC), BenMen-1 (BM1) and KT21-MG1 (KT21) meningioma cells showing elevated ALDH1A1 expression in both human NF2-null cell lines. (D) Quantification of western blot in C. (E) Lentiviral shRNA knockdown of YAP or TAZ in BenMen-1 cells showing that ALDH1A1 expression is dependent upon TAZ. (F) Quantification of western blot in E. (G–I) ALDH1A1 inhibitor 1 reduces proliferation of BenMen-1 cells. (J) Quantification of percentage Ki-67-positive cells with increasing ALDH1A1 inhibitor concentrations. (K–M) Comparison of the effects of shRNA knockdown of ALDH1A1 (L) and TAZ (M) upon cell proliferation in BenMen-1 cells. (N) Quantification of percentage EdU-positive cells. For data presented, n = 3. Data presented in graphs are means ± SEM. Statistical analysis shown is a one-way ANOVA with Bonferroni’s correction. *P < 0.05; **P < 0.01; ***P < 0.001; ns = not significant. Scale bars = 25 μm.

