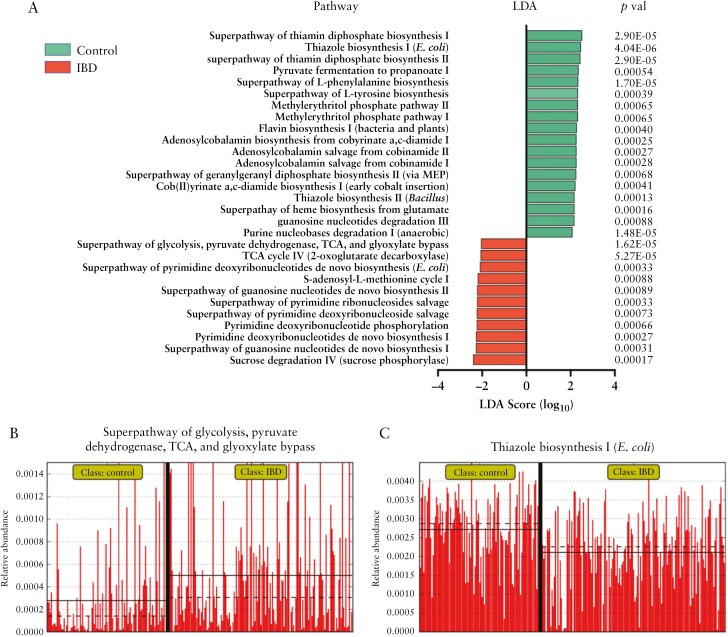
Figure 4.
[a] LEfSe plot showing predicted MetaCyc pathways exhibiting significant differences in abundance in control or IBD patients. Differential abundance is indicated by the linear discriminant analysis [LDA] effect size score. Green bars are control associated and red bars IBD associated. Only features with Kruskall–Wallis p < 0.001 are shown. [b] Relative abundance of selected pathways [Thiazole biosynthesis and Superpathway of glycolysis and TCA] in controls and IBD patients.

