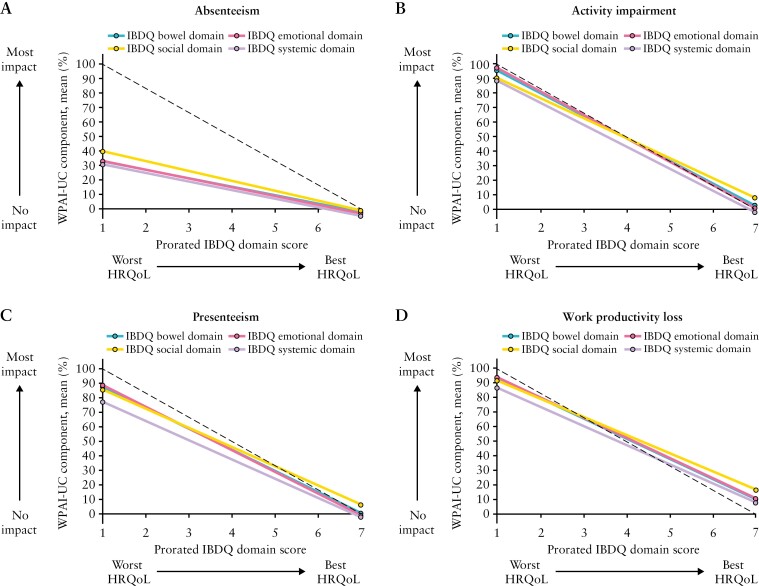
Figure 5.
Relationship between the four IBDQ domains and each individual WPAI-UC component [main model with IBDQ domain score as a continuous anchor]; HRQoL, health-related quality of life; IBDQ, Inflammatory Bowel Disease Questionnaire; WPAI-UC, Work Productivity and Activity Impairment-Ulcerative Colitis. WPAI-UC scores are expressed as percentages, with a higher percentage indicating greater impairment and less productivity. IBDQ domain scores were prorated and converted to represent the mean of the items within a range of 1 to 7, and a higher score indicates a better HRQoL. The dotted line represents a perfect relationship [maximum y corresponds to minimum x, and minimum y to maximum x].

