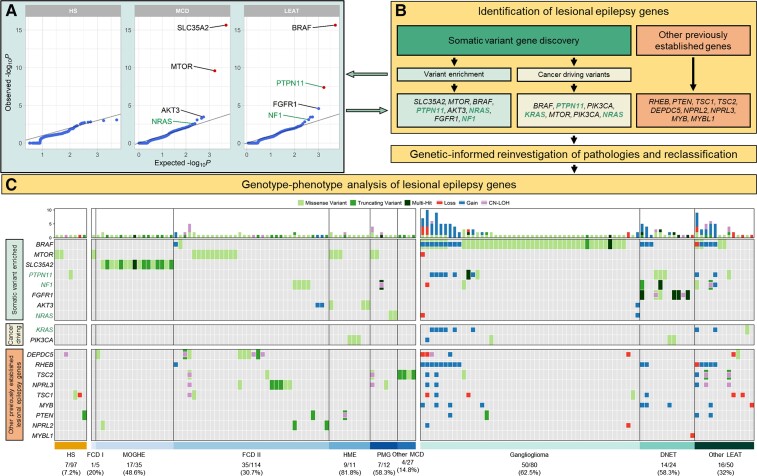
Figure 2.
Characterization and histopathological annotation of genes associated with epileptogenic lesions. (A) Quantile–quantile plots of the gene burden analysis results. Highlighted genes represent identified genes of interest (see ‘Materials and methods’ section). Known and novel genetic associations and candidate genes are labelled with the corresponding gene name (MCD: SLC35A2, MTOR and AKT3 = known causal genes, NRAS = candidate gene; LEAT: BRAF and FGFR1 = known causal genes, NF1 = candidate gene, PTPN11 = significantly enriched gene). Statistically significant somatic variant enrichment was defined by false discovery rate-corrected P-value < 0.1. (B) Flow diagram for identifying genes of interest associated with lesional epilepsies and genotype-phenotype relationships. PTPN11, NF1, NRAS and KRAS were considered novel genetic associations or candidate genes. (C) Somatic mutation profiles for 151 mutation-positive epileptogenic lesions. Each column represents an individual sample with rectangles highlighting identified variants across 19 genes associated with lesional epilepsies. Larger rectangles represent SNV, and smaller squares represent CNV or CNN-LOH. Gain = somatic copy number gain; Loss = somatic copy number loss; PMG = polymicrogyria.

