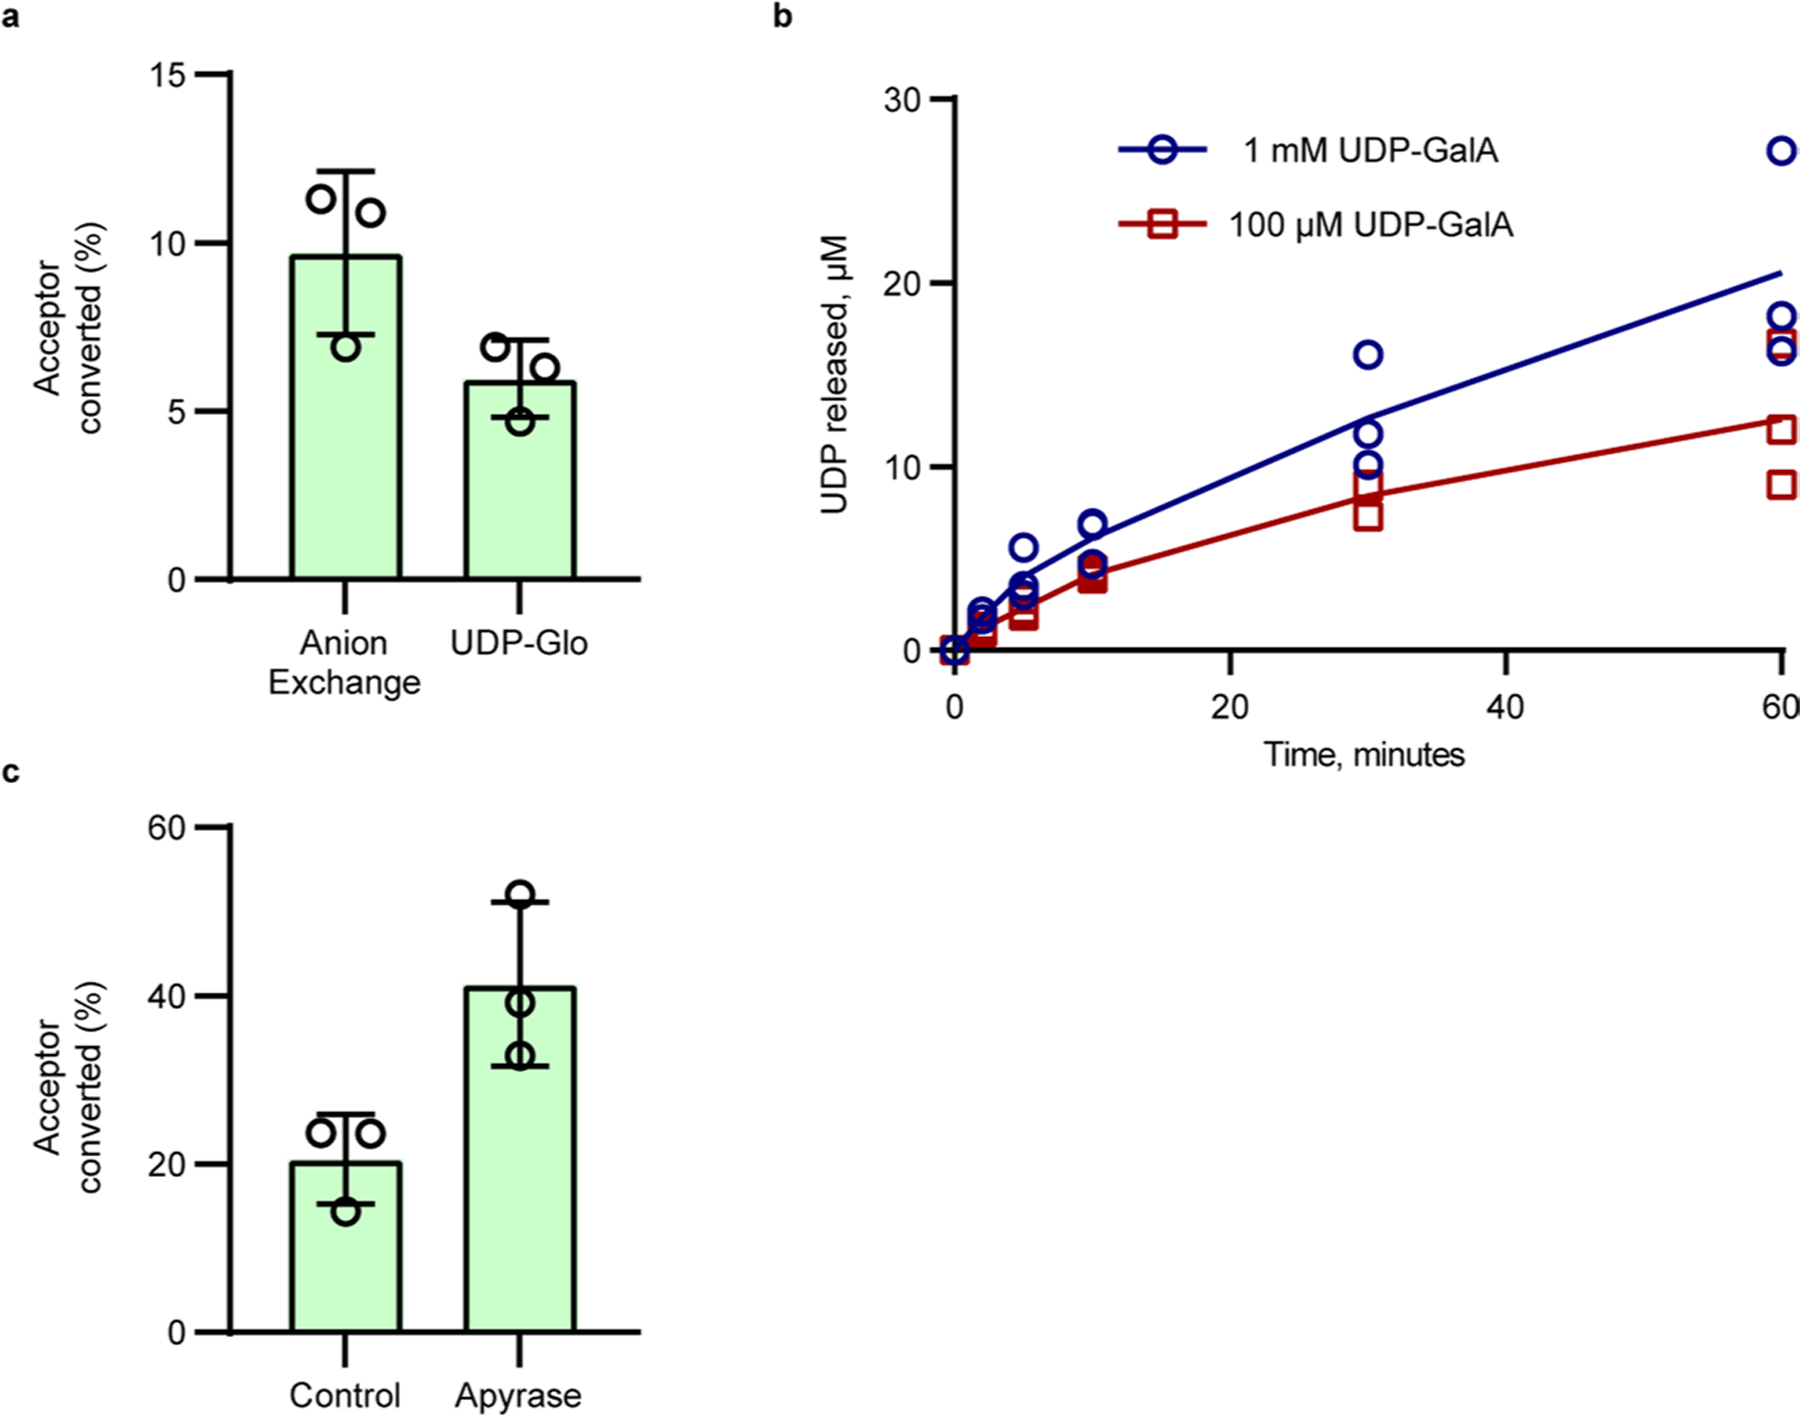
Extended Data Fig. 4 |. Biochemical characterization of RGGAT1 activity.

a, Comparison of RGGAT1 activity using two independent methods. For anion exchange, percentage of acceptor converted was calculated based on the relative proportion of the peaks for the DP12 (R) acceptor and DP13 (G) in the fluorescence chromatogram. For UDP-Glo, activity was measured as a function of UDP released in a 10 min assay containing 1 mM UDP-GalA and 100 µM acceptor. This activity value was presented as “percentage of acceptor converted” based on the conversion that 1 µM UDP released is equal to conversion of 1% of the starting DP12 (R) acceptor to a DP13 (G) product. Reactions contained 50 nM enzyme. Error bars represent the standard deviation from three independent experiments. b, Progress curve of activity using UDP-Glo. In all assays, each point represents the average of duplicate luminescence readings. The blue (assay with 1 mM UDP-GalA) and red (assay with 100 µM UDP-GalA) lines represent the average activity from three independent assays containing 50 nM enzyme. The results from independent assays are shown as individual points. c, Percentage of acceptor conversion was enhanced by addition of a phosphatase (potato apyrase, Sigma A6132) to the reaction. Percentage of acceptor converted was measured as the relative proportion of the peak area of the product to the remaining acceptor at 60 minutes in a reaction containing 50 nM enzyme, 1 mM UDP-GalA, and 100 µM DP12-2AB (R) acceptor. Error bars represent the standard deviation from three independent experiments.
