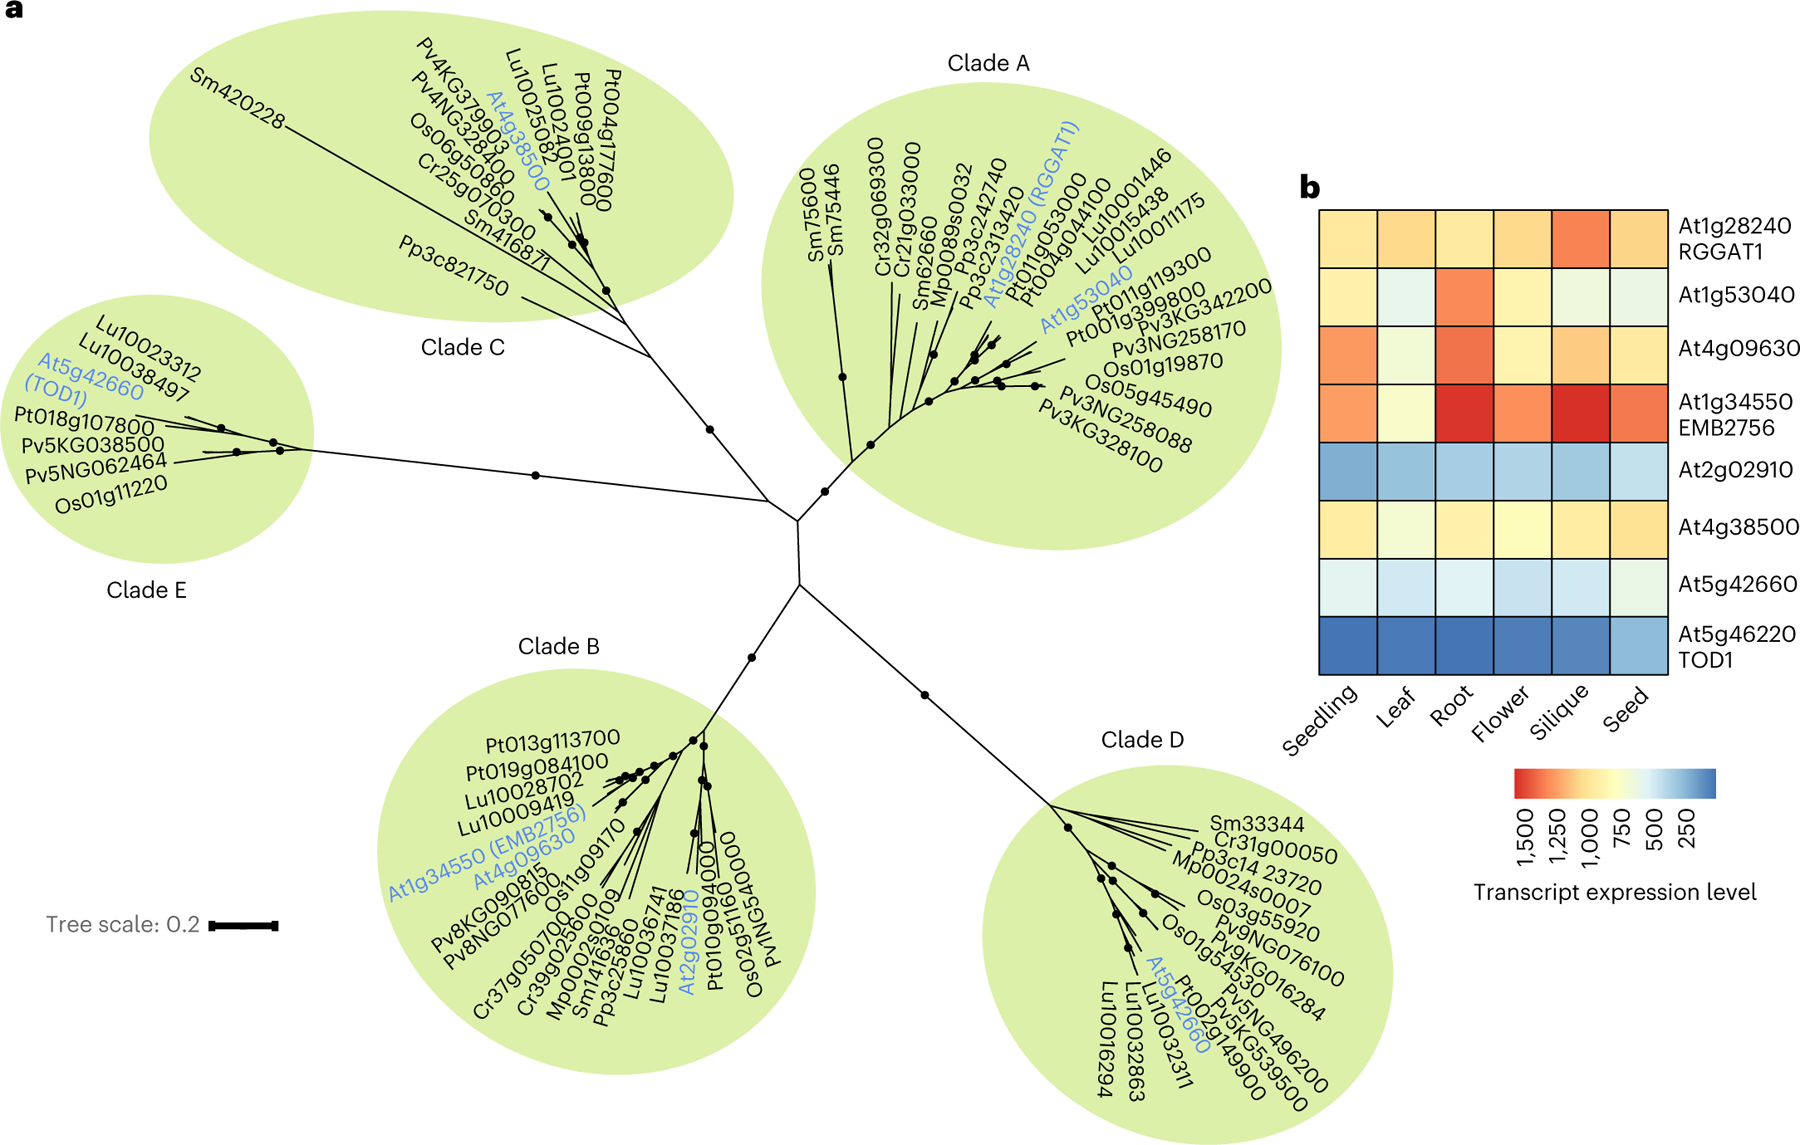
Fig. 7 |. Phylogenetic tree and tissue expression of GT116 family proteins.

a, Phylogenetic tree containing 77 GT116 sequences from 9 plant species. Arabidopsis gene names are in blue and organized into 5 clades. The clades (A, B, C, D and E) were ranked according to the primary amino acid sequences with the highest similarity to RGGAT1. Black circles indicate support for nodes with bootstrap values of greater than 90% from 500 bootstrap trials. Branch lengths indicate genetic divergence, with the scale bar indicating the average number of substitutions per amino acid. At, Arabidopsis thaliana; Cr, Ceratopteris richardii (fern); Lu, Linum usitatissimum (flax); Mp, Marchantia polymorphia (liverwort); Os, Oryza sativa (rice); Pv, Panicum virgatum (switchgrass); Pt, Populus trichocarpa (poplar); Pp, Physcomitrium patens (bryophyte); Sm, Selaginella moellendorffi (lycophyte). b, Heat map of RNA-seq data retrieved from TravaDB39 for each GT116 family member from 6 Arabidopsis tissues. Expression values are absolute read counts from selected tissues. For mature tissues in which data from several developmental stages were available (flowers, siliques, seeds), younger tissues that had not reached senescence were selected.
