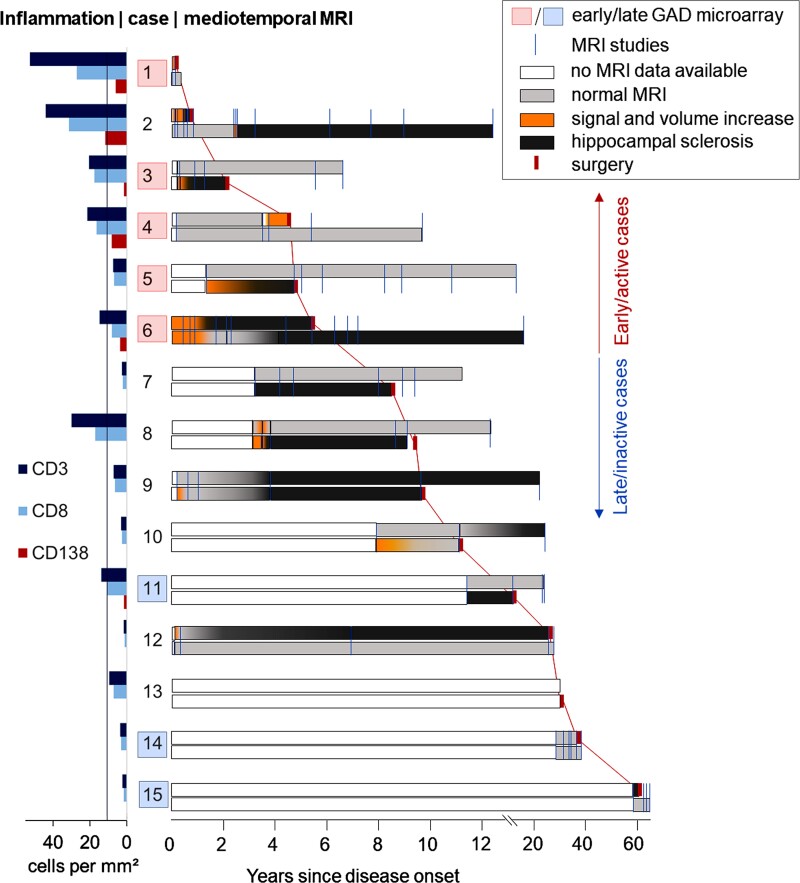
Figure 1.
Clinical course during GAD antibody-associated TLE. The clinical courses of the patients with GAD antibody-associated TLE arranged by disease duration (from short to long), with corresponding lymphocytic densities in mediotemporal brain samples. Each line represents one patient. The large numbers are the study IDs. To the right of the IDs are the MRI courses. Blue orthogonal lines: MRI studies. Upper rows: right mediotemporal lobes; lower rows: left mediotemporal lobes. White bars: no MRI data available; light grey bars: normal mediotemporal MRI; orange bars: signal and volume increase on T2/FLAIR images; dark grey bars: hippocampal atrophy with bright signal—that is, HS; red orthogonal marks, connected by red lines (for better visibility): time points of surgery. On the right, our grouping into ‘early/active inflammatory’ versus ‘late/inactive’ cases (see the ‘Materials and methods’ section) is indicated. The diagram to the left of the IDs gives the lymphocytic densities in the patients’ mediotemporal brain samples. The line at 11 cells/mm2 indicates the 75th percentile of hippocampal densities of CD3+ and CD8+ T cells in 41 patients with mediotemporal lobe epilepsy of different aetiologies from a previous study.22 The red boxes indicate GAD-early cases with upregulated immune pathways; the light blue boxes indicate GAD-late stages with lack of overexpressed pathways (see whole transcriptome analysis). Note the early presumable ‘encephalitic’ stages (orange) predating the development of HS and the correlation between shorter disease durations and higher densities of lymphocytic infiltrates.

