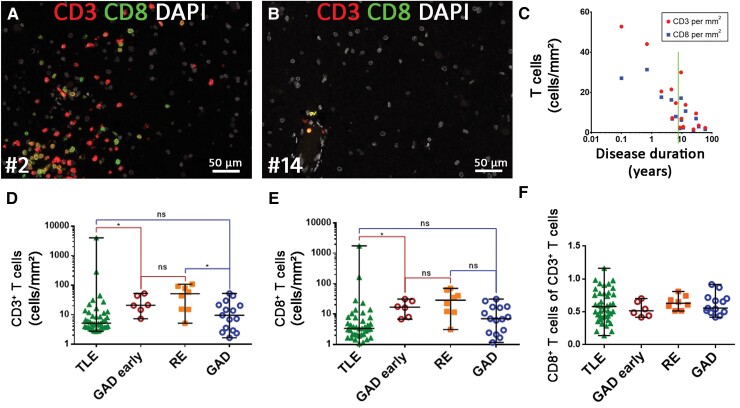
Figure 4.
T cell infiltration in GAD-TLE compared to other cohorts. (A and B) Multiplex imaging for CD3+ and CD8+ T cell subsets in a case with short (A, Patient 2) versus long (B, Patient 14) disease duration. For the long disease duration, only a few T cells are seen in perivascular position. (C) Quantification of *CD3+ T cells (red) and **CD8+ T cells (blue) shows a decrease in these cells during GAD-TLE (Spearman correlation test: *P = 0.0023, r = −0.7393 **P = 0.0023, r = −0.7393). (D) CD3+ T cell infiltration and (E) CD8+ CTL infiltration is significantly higher in the GAD-early subgroup than in TLE of different genesis but not than RE. This does not apply for entire the GAD group (GAD). (F) There is no significant difference regarding CD8+/CD3+ ratio in the respective groups. Kruskal–Wallis test with Dunn’s post hoc correction was performed. Data are indicated as median with full range. *P < 0.05, ns = not significant. The TLE and RE cohorts were described earlier.22

