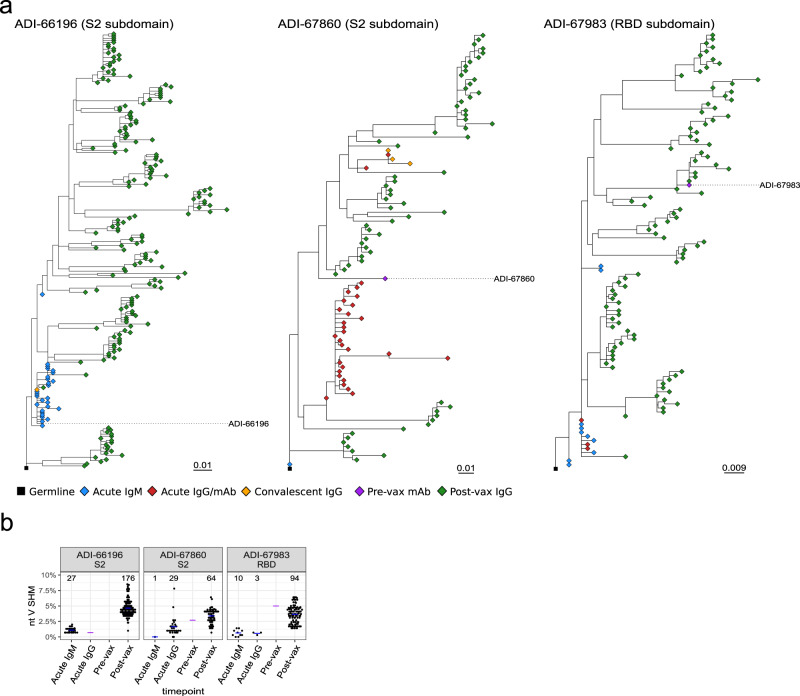
Fig. 4. Evolution of SARS-CoV-2 S-specific antibody lineages over the sampling timepoints.
a Maximum-likelihood phylogenetic tree of traced lineages containing IgM Rep-seq sequences: ADI-66196, ADI-67860, and ADI-67983. Germlines sequences were obtained from the IgBLAST-generated “germline_alignment” column of the sequence with the smallest IGHV SHM in the lineage. b Dot plot of % nucleotide IGHV SHM for the ADI-66196, ADI-67860, and ADI-67983 lineage sequences. Purple crossbars represent mAb values, while the blue crossbars represent average values of traced variants for each timepoint.

