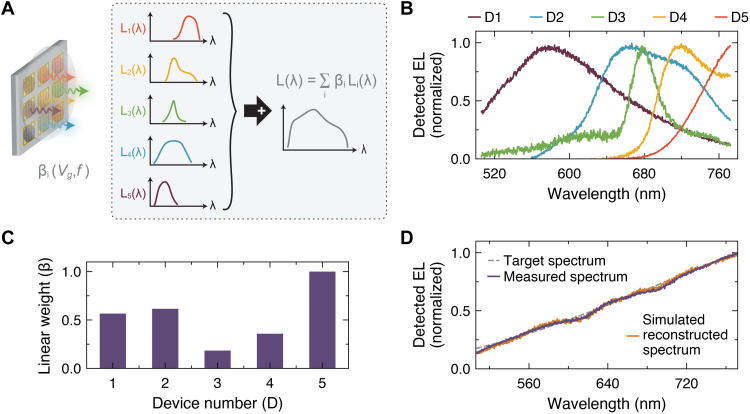
Fig. 2. Design of arbitrary EL spectra.
(A) Schematic depicting generation of arbitrary EL spectra using an EL array. (B) Example of EL spectra and (C) relative weights of the corresponding spectra used to reconstruct the target spectrum in (D). The dashed gray curve represents the desired target spectrum. The purple curve represents the experimentally measured spectrum from the implemented five-device EL array. The gold curve represents the designed spectrum from calculation.

