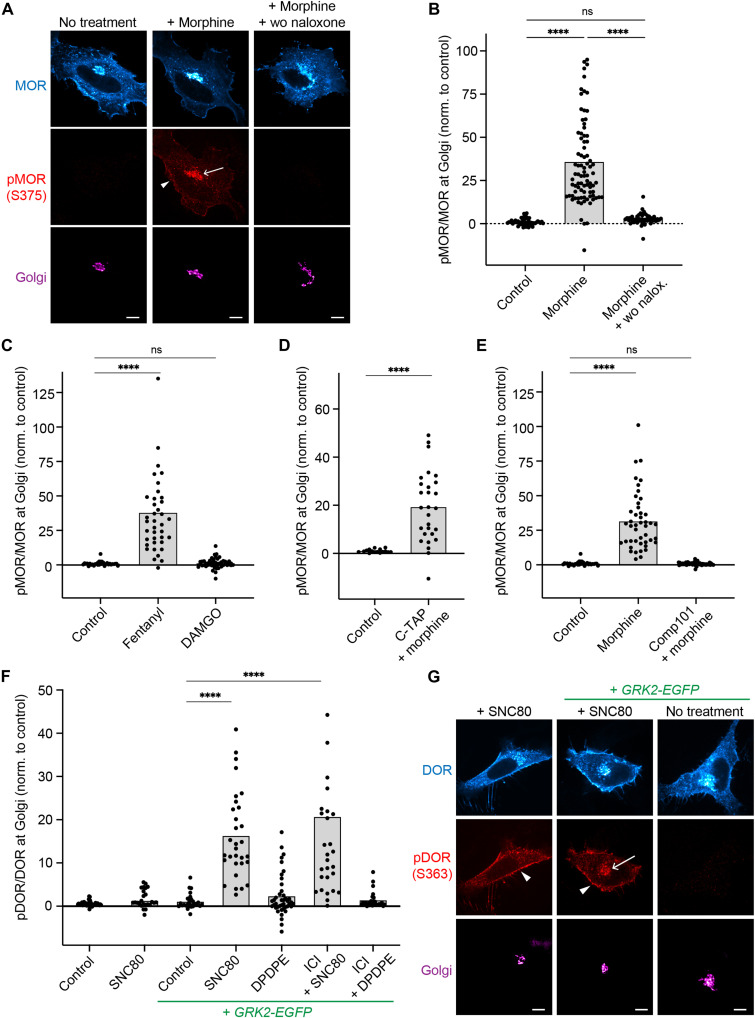
Fig. 2. GRK2/3 phosphorylate activated MOR and DOR in the Golgi apparatus.
(A) Confocal images of HeLa cells expressing FLAG-MOR and ManII-BFP (magenta). Cells were fixed, permeabilized, and immunolabeled with anti-FLAG (cyan) and anti-MOR-pS375 (red) antibodies. Cells treated with 10 μM morphine for 5 min. In the washout condition (wo, right), 10 μM morphine was washed out after 5 min and 100 μM naloxone was added for 10 min. Arrow depicts pMOR at Golgi, and arrowhead depicts pMOR at PM. Scale bar, 10 μm. (B to E) Quantification of pMOR/MOR fluorescence at Golgi (ManII-labeled). Cells transfected and stained as in (A). (C) DAMGO used at 10 μM, fentanyl at 1 μM. (D) Cells pretreated with 10 μM CTAP for 5 min, followed by 100 nM morphine for 5 min. ****P < 0.0001 by Welch’s t test. (E) Cmpd101 (30 μM; GRK2/3 inhibitor) was added 45 min before adding 10 μM morphine for 5 min. N = 3 with >30 cells. ****P < 0.0001 by ordinary one-way ANOVA for (B), (C), and (E). (F) Quantification of pDOR/DOR fluorescence at Golgi. Cells transfected and stained as in (G). Cells treated with 10 μM SNC80 or DADLE. In ICI conditions, 100 μM ICI was added 10 min before treatment with 100 nM SNC80 or DADLE. Conditions with GRK2-EGFP coexpression are labeled. N = 3 with >25 cells. ****P < 0.0001 by ordinary one-way ANOVA. (G) Confocal images of HeLa cells expressing FLAG-DOR and ManII-BFP (magenta). Cells fixed, permeabilized, and immunolabeled with anti-FLAG (cyan) and anti-DOR-pS363 (red) antibodies. Treatment with 10 μM SNC80 for 5 min of cells with or without GRK2-GFP expression. Arrow depicts pDOR at Golgi, and arrowheads depict pDOR at PM. Scale bars, 10 μm. ns, not significant.

