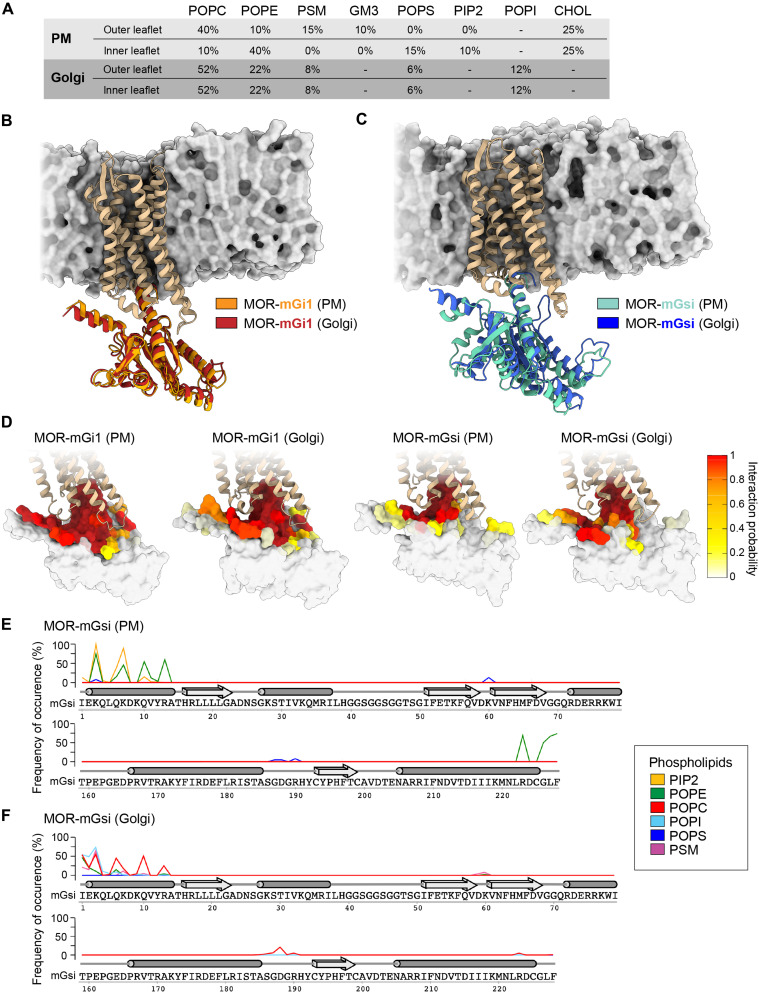
Fig. 4. The lipid environment regulates OR–mGsi interaction.
MD simulations carried out with MOR-mGi1 and MOR-mGsi heterodimers in PM and Golgi-like membrane models. (A) Lipid composition of PM and Golgi-like membrane models used. POPC, 1-palmitoyl-2-oleoyl-sn-glycero-3-phosphocholine; POPE, 1-palmitoyl-2-oleoyl-sn-glycero-3-phosphoethanolamine; PSM, palmitoyl sphingomyelin; GM3, monosialo dihexosyl ganglioside; POPS, 1-palmitoyl-2-oleoyl-sn-glycero-3-phosphoserine; PIP2, 1,2-diacyl-sn-glycero-3-phospho-1-D-myo-inositol 4,5-bisphosphate; POPI, 1-palmitoyl-2-oleoyl-sn-glycero-3-phosphoinositol; CHOL, cholesterol. (B and C) Superimposition of the most relevant conformations assumed by the MOR-mGi1 and MOR-mGsi heterodimers in PM and Golgi membranes. MOR is tan. (B) mGi1 in the PM environment is orange, and mGi1 in the Golgi environment is red. (C) mGsi in the PM environment is teal, and mGsi in the Golgi environment is blue. Lipid bilayer schematics are based on the Golgi membrane models, displayed through their solvent exposed surface (gray). (D) Frequency of occurrence of contacts between MOR and mGi1 or MOR and mGsi in PM or Golgi membranes. mGi1 and mGsi are represented through their solvent exposed surfaces and colored according to the local interaction probability values, following depicted color gradient. (E and F) Frequencies of occurrence of contacts between mGsi and phospholipids in the PM (E) and the Golgi membrane (F). The α-helices (tubes) and β-sheets (arrows) of mGsi are displayed. The frequency of interaction of each phospholipid species is colored according to the legend. mGsi residues 70 to 159 are omitted since no lipid interactions were detected.

