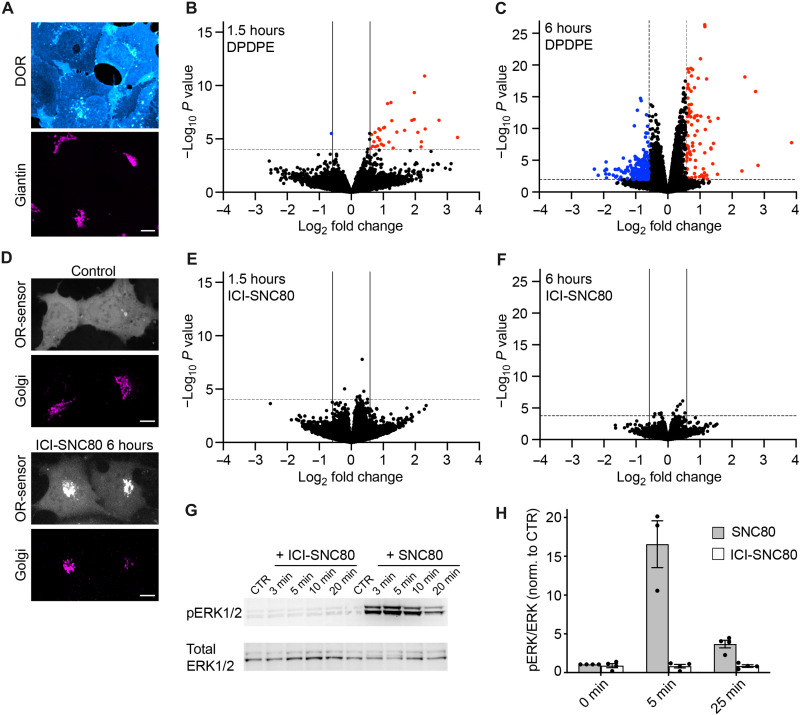
Fig. 5. Golgi-restricted DOR activation does not promote a transcriptional response.
(A) Confocal images of HEK293 cells stably expressing FLAG-DOR (HEK293-DOR). Cells were fixed, permeabilized, and immunolabeled with anti-FLAG (cyan) and anti-giantin (magenta) antibodies. Scale bar, 10 μm. (B and C) Volcano plots of differentially expressed genes in HEK293-DOR cells treated with DPDPE (100 nM) for 1.5 hours (B) or 6 hours (C) versus mock-treated control cells. Results are presented as the mean differential gene expression from three replicates and expressed as log2FC. Genes significantly up-regulated are shown in red [quasi-likelihood F-test (QL F-test), FC > 1.5, adjusted P < 0.05]. Genes significantly down-regulated are shown in blue (QL F-test, FC < –1.5, adjusted P < 0.05). (D) Confocal images of HEK293-DOR cells expressing EGFP-Nb33 (gray) and GalT-DsRed (magenta). Control cells and cells treated for 6 hours with ICI (100 μM, 5 min preincubation) and SNC80 (100 nM). Scale bar, 10 μm. (E and F) Volcano plots of differentially expressed genes in HEK293-DOR cells treated with ICI-SNC80 (ICI = 100 μM, SNC80 = 100 nM) for 1.5 hours (E) or 6 hours (F) versus control cells (100 μM ICI treated). Results are presented as the mean differential gene expression from three replicates and expressed as log2FC. No genes are significantly changed in their expression [criteria as in (B) and (C)]. (G) Immunoblot of ERK1/2 activation upon treatment of HEK293-DOR cells with ICI-SNC80 (100 μM and 100 nM) or SNC80 (100 nM) for indicated times or untreated control (CTR). (H) Quantification of pERK1/2 protein levels normalized to total ERK1/2 in HEK293-DOR cells treated as in (G), for 5 min and 25 min. N = 3, mean ± SEM.

