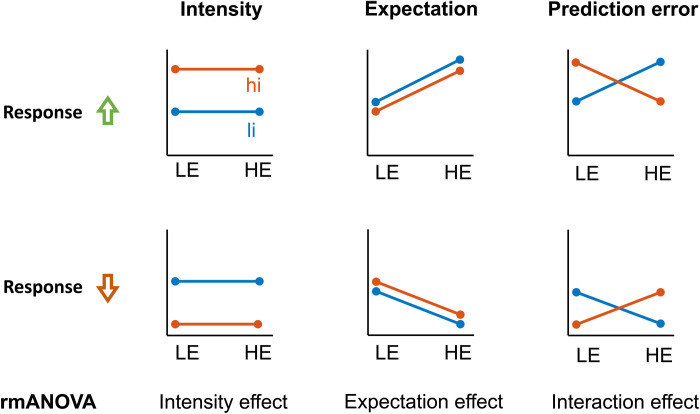
Fig. 3. Possible response patterns indicating the effects of stimulus intensity, expectations, and (absolute) PEs.
Effects of stimulus intensity (li and hi), expectations (LE and HE), and PEs were tested by means of repeated measures analyses of variance (rmANOVAs). An experimental modulation can lead to either a relative increase (first row) or relative decrease (second row) of oscillatory activity or connectivity.

