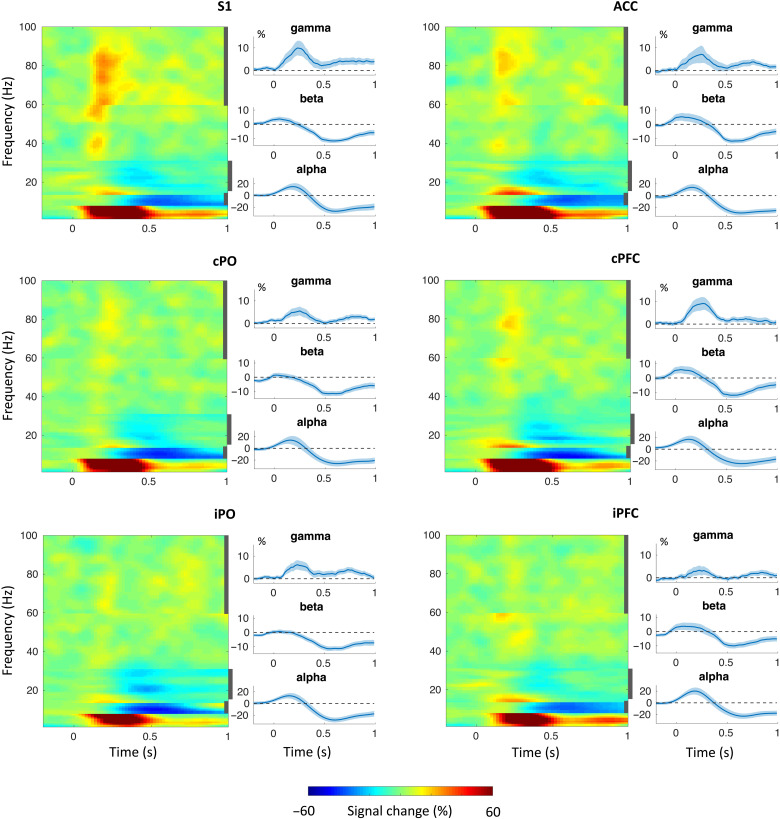
Fig. 5. TFRs based on hi trials of local oscillatory brain activity in the six ROIs.
The first and third columns show concatenated band specific time-frequency representations (TFRs) for all six ROIs. The sharp transitions in the TFRs are due to the employment of frequency band-specific spatial filters. The second and fourth columns show time courses of brain activity in the alpha, beta, and gamma band. Vertical, dark gray bars in the TFR plots indicate the frequency intervals based on which the time courses of brain activity were computed.

