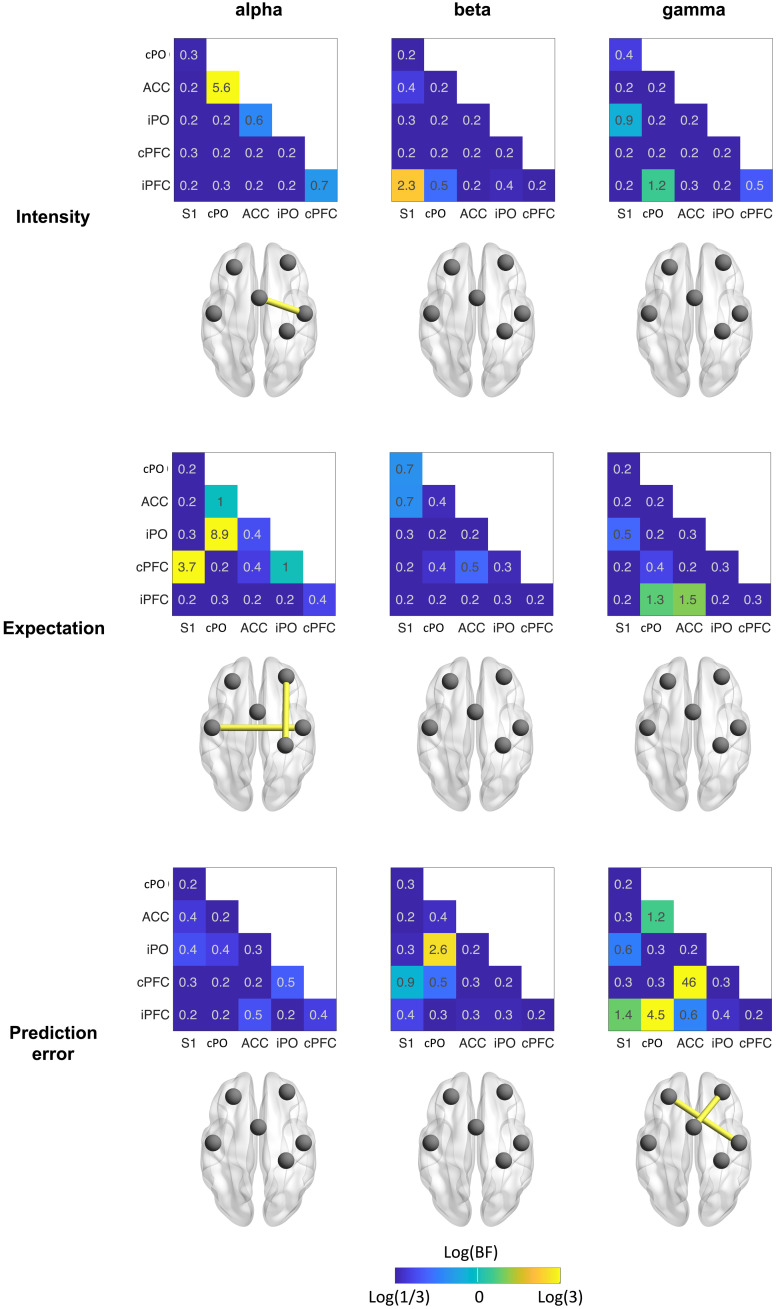
Fig. 7. Effects of stimulus intensity, expectations, and PEs on interregional functional connectivity.
Effects were assessed by Bayesian rmANOVA with the factors intensity and expectation. The color of the heat map tiles scales with the log of the BF. It ranges from blue (BF < 0.33, at least moderate evidence against an effect) to yellow (BF > 3, at least moderate evidence for an effect). Brain images display connections in yellow which exhibit at least moderate evidence for an effect (BF > 3).

