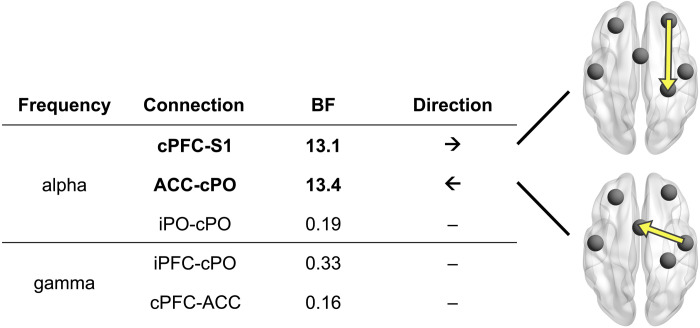
Fig. 8. Direction of functional connectivity.
Using an asymmetry score based on the PDC connectivity metric, we assessed the direction of information flow in connections that exhibited evidence for an effect in the previous connectivity analysis. Brain images depict connections with strong evidence for asymmetric information flow. The arrows indicate the dominant direction of information flow.

