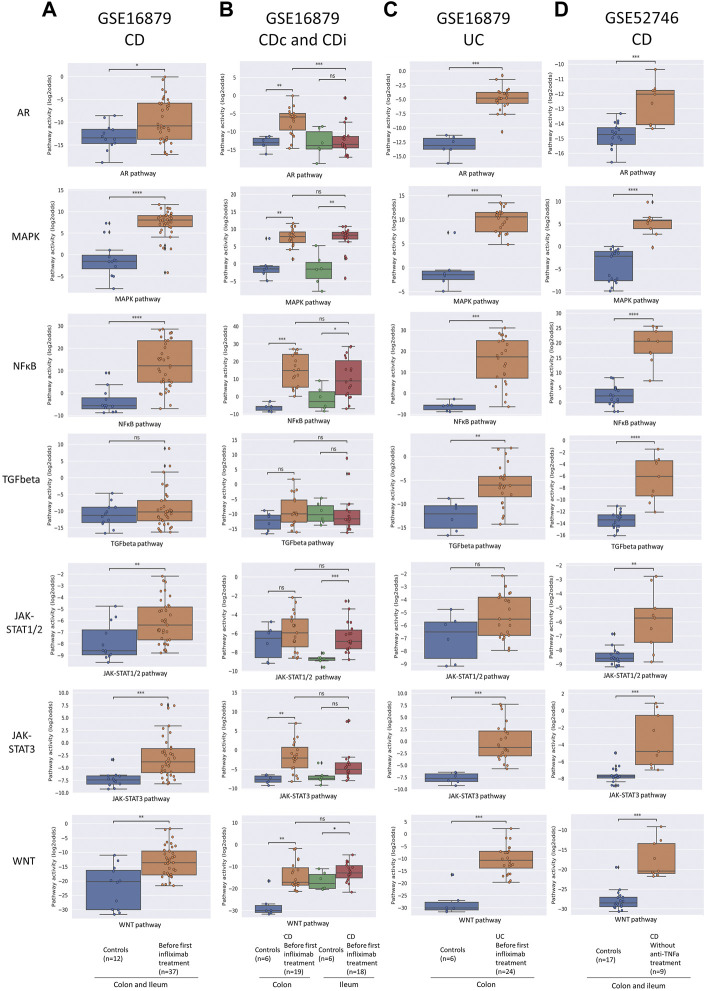
FIGURE 1.
Diagnosis of IBD. Datasets indicated on top of figure (A–D). STP activity analysis of intestinal mucosa samples for diagnosis of IBD. Mucosa samples from healthy control individuals and pre-treatment mucosa samples from IBD patients. For details, see Methods. Signal transduction pathway (STP) activity scores (PAS) are shown for the androgen receptor (AR), MAPK, NFκB, TGFβ (TGFbeta), JAK-STAT1/2, JAK-STAT3, and Wnt STPs. PAS on Y-axis on a log2 odds scale. Two sided Mann-Whitney-Wilcoxon statistical tests were performed; p-values are indicated in the figures as *p < 0.05, ***p < 0.001, ****p < 0.0001, ns: not significant.

