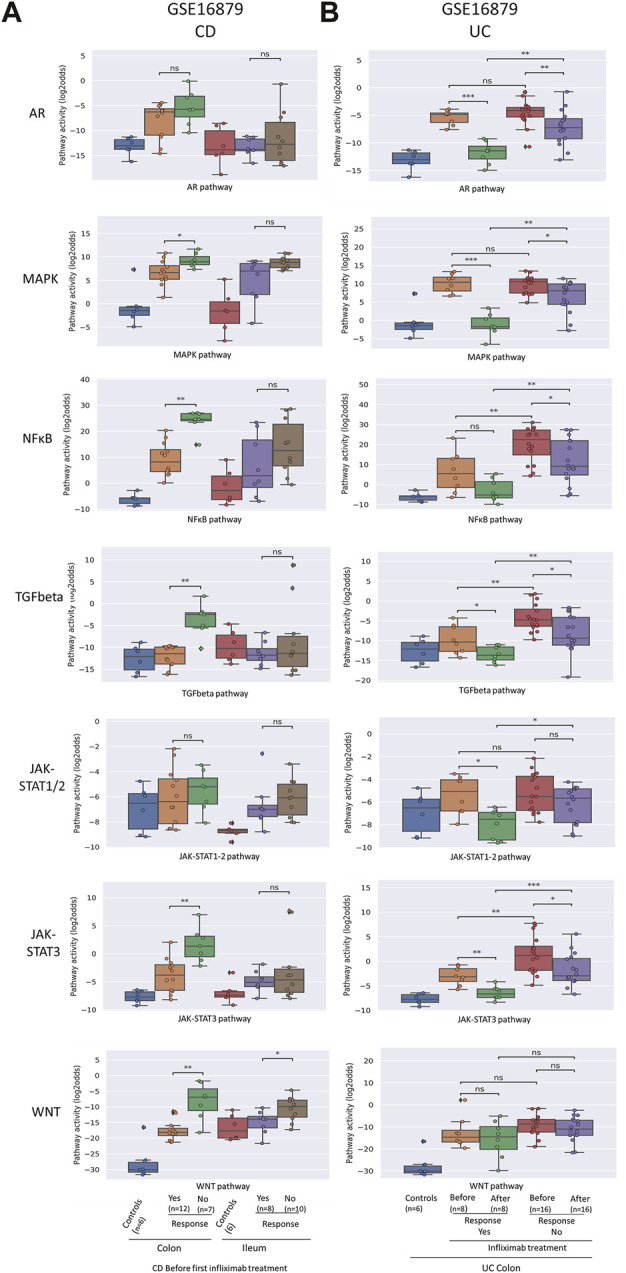
FIGURE 2.

Prediction and assessment of response to anti-TNFα remission-induction treatment in CD (A) and UC (B). Datasets GSE16879. STP activity analysis of intestinal mucosa samples for prediction of response to anti-TNFα remission induction treatment in patients with CD and UC. STP PAS before and after remission induction treatment. For details, see Methods. STP PAS are shown for the AR, MAPK, NFκB, TGFβ, JAK-STAT1/2, JAK-STAT3, and Wnt STPs. Two sided Mann–Whitney–Wilcoxon statistical tests were performed; p-values are indicated in the figures as *p < 0.05, **p < 0.01, ***p < 0.001, ****p < 0.0001, ns: not significant. For supporting analysis results, see Supplementary Table S1.
