
FIGURE 4.
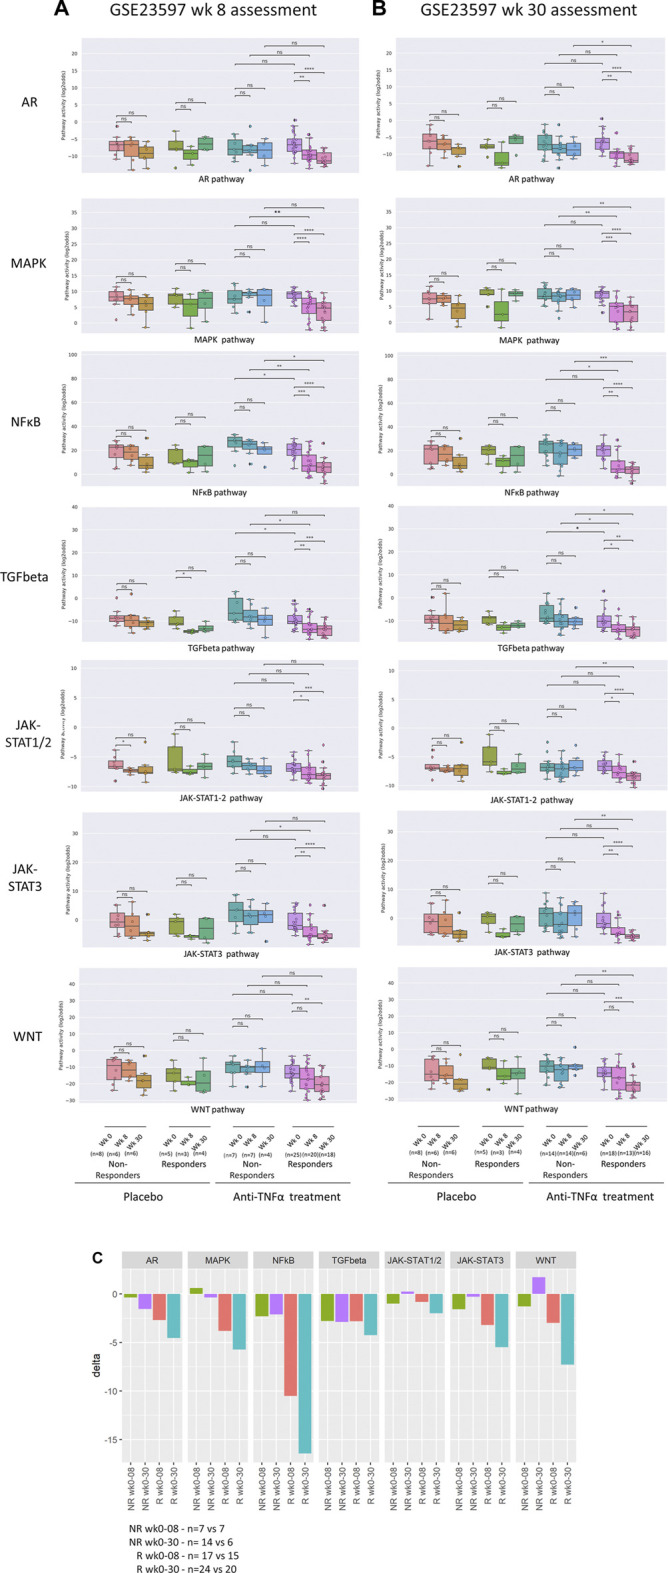
Assessment of response to anti-TNFα remission-induction versus maintenance treatment. Dataset GSE23597. STP activity analysis of intestinal mucosa samples for assessment of response to low or high dose anti-TNFα remission maintenance treatment of patients with UC. Clinical response to treatment was assessed at 8 [(A), remission-induction treatment] and 30 [(B), maintenance treatment] weeks after start of treatment. Treatment with infliximab, 5 or 10 mg/kg, or placebo. Colon mucosa samples: 0, 8, and 30 weeks of treatment. For STP analysis, data of 5 and 10 mg/kg were combined. For details, see Methods. (A) STP activity scores (PAS) at 0, 8, and 30 weeks of treatment. Clinical response assessment at 8 weeks, following remission induction treatment. (B) PAS at 0, 8, and 30 weeks of treatment. Clinical response assessment at 30 weeks, following remission-induction and maintenance treatment. (C) Mean delta (delta PAS calculated per individual patient) PAS between 0 and 8 weeks, and between 0 and 30 weeks of treatment, for responders (R; red and turquoise) and non-responders (NR; green and purple). STP PAS shown for AR, MAPK, NFκB, TGFβ, JAK-STAT1/2, JAK-STAT3, and Wnt STPs. PAS on Y-axis on a log2 odds scale. Two sided Mann–Whitney–Wilcoxon statistical tests were performed; p-values are indicated in the figures as *p < 0.05, **p < 0.01, ***p < 0.001, ****p < 0.0001, ns: not significant. For supporting analysis results, see Supplementary Table S1.