. 2023 Mar 8;12:e81224. doi: 10.7554/eLife.81224

Figure 3. Predictive models of DNA damage response (DDR) gene deficiencies.

(a) The precision-recall AUC enrichment PR-AUC-E; x-axis and significance (false discovery rate [FDR]; logarithmic y-axis) of the 535 predictive models (one model per gene with more than 5 biallelic or more than 10 tumours either mono- or biallelic mutated in either Hartwig Medical Foundation (HMF) or The Pan-Cancer Analysis of Whole Genomes (PCAWG) in any one cancer type; Methods). Significance (q-value representing FDR) evaluated by counting equally or more-extreme PR-AUC-E values across >10,000 permuted data sets and applying Benjamini–Hochberg FDR control. Models with FDR below 0.05 and PR-AUC-E above 0.2 are shortlisted (Methods). (b) Shortlisted predictive models of deficiency of BRCA1 or BRCA2; (c) TP53 monoallelic predictive models; (d) monoallelic gene deficiency models across colorectal cancer patients; and (e) remaining gene deficiency models not contained in the other sub-groups. Numbers indicate the number of mutated out of the total number of tumours included in the development of each model.

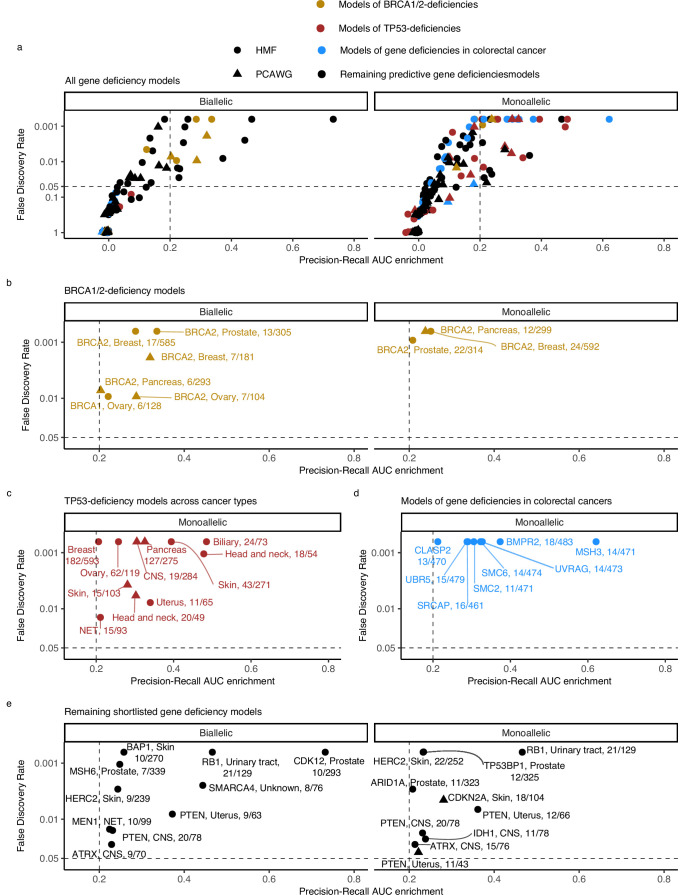
Figure 3.

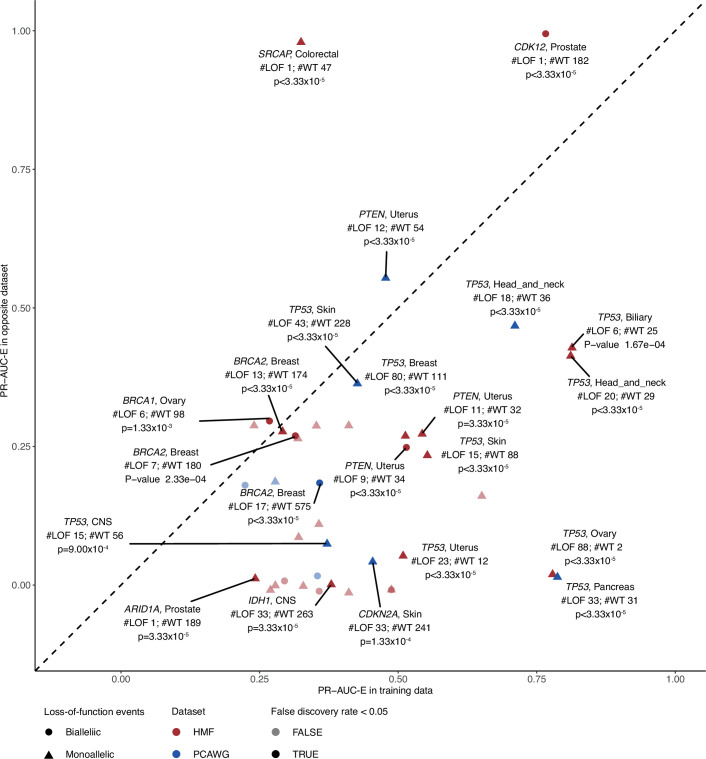
Figure 3—figure supplement 1. Evaluating model performance in the opposite data set.

Figure 3—figure supplement 1.

Predictive potential in the opposite data set, evaluated for each of the shortlisted models. The PR-AUC-E in the training data (x-axis) and opposite data (y-axis) are shown with labels for models that attain significant predictive power in the opposite data (shaded; false discovery rate <0.05; 30.000 permutation tests). Shape indicates the allelic loss-of-function (LOF) event (circle biallelic and triangle monoallelic); colours indicate the data set in which the model was trained, either metastatic tumours (Hartwig Medical Foundation; HMF) or primary tumours (The Pan-Cancer Analysis of Whole Genomes; PCAWG). #LOF indicates the number of LOF mutated tumours in the opposite data set, #WT the number of non-LOF tumours.
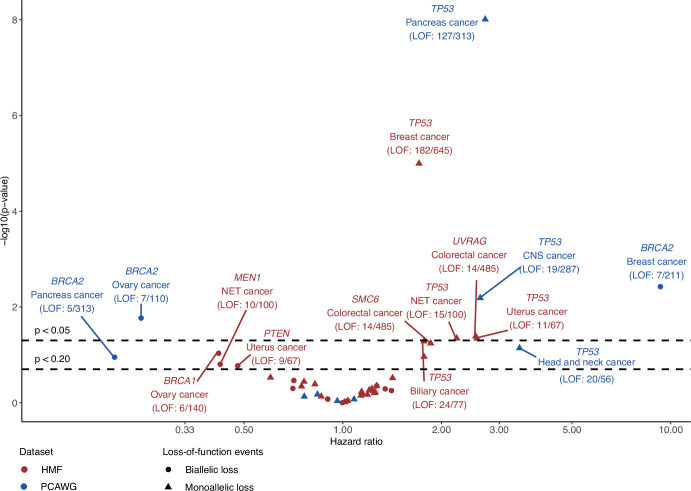
Figure 3—figure supplement 2. Survival analysis of patients with or without loss-of-function (LOF) events in shortlisted DNA damage response (DDR) genes.

Figure 3—figure supplement 2.

The hazard ratio (x-axis) based on overall survival between patients with or without gene LOF and its associated p-value (y-axis; −log10) evaluated using the Cox proportional hazard model for DNA damage response genes and cancer-type cohorts of the shortlisted predictive models. Models were trained on either Hartwig Medical Foundation (HMF; red) or The Pan-Cancer Analysis of Whole Genomes (PCAWG; blue) data to identify either biallelic (circle) or monoallelic (triangle) LOF. Labels are added for models with p values <0.2, including the number of patients with a gene LOF event versus total number of given cancer-type cohort patients (LOF patients/total patients).
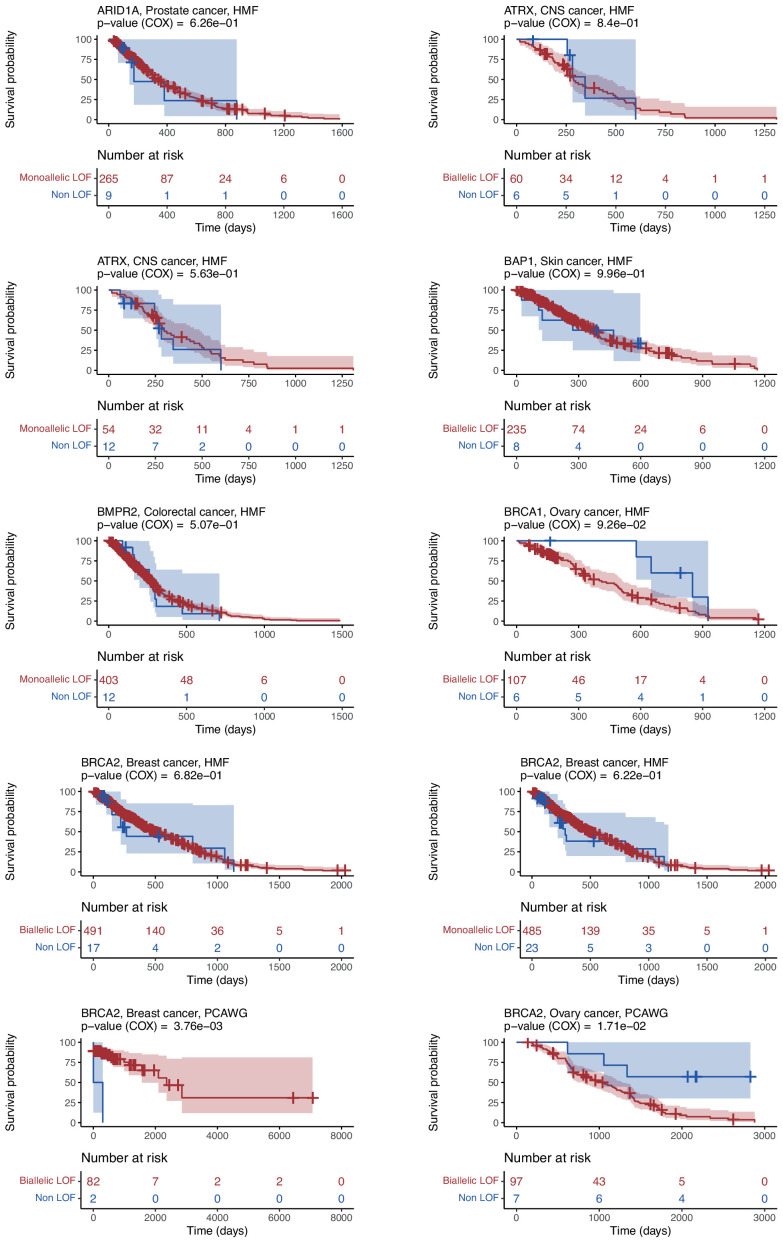
Figure 3—figure supplement 3. Kaplan–Meier survival plots for patients from cancer-type cohorts used to train the 48 shortlisted models.

Figure 3—figure supplement 3.

Separate Kaplan–Meier plots showing the overall survival of patients with loss-of-function (LOF; red) or no-LOF (blue) in each gene for relevant cancer-type cohorts. The percentage still included in the study (y-axis) at a given timepoint (x-axis). Numbers indicate the number of patients included at a given time.