. 2023 Mar 8;12:e81224. doi: 10.7554/eLife.81224

Figure 6. Novel predictive models of DNA damage response (DDR) gene deficiencies.

(a) Predictive model of ATRX-d and its PR-AUC-E, area under the receiver operator characteristic (AUROC), and selected features and their coefficients. Same information for predictive models of (b) IDH1-d, (c) SMARCA4-d, (d) CDKN2A-d, (e) HERC2-d, and (f) PTEN-d in central nervous system (CNS) cancers and (g) uterine cancers. (h) Number of single-base substitution (SBS) sig. 27 and SBS sig. 4 (y-axis; logarithmic) among tumours of unknown primary with SMARCA4 biallelic loss-of-function (LOF) (red) or wild-type (grey). (i) Pearson correlation between the per-tumour number (tumours of unknown primary; Hartwig Medical Foundation [HMF]) of SBS signature 27 (y-axis) and SBS signature 4 (x-axis; logarithmic) mutations, with an overlaid linear model (blue) and its 95% confidence interval (grey). (j) Using a model trained to predict SMARCA4 biallelic LOF in HMF cancers of unknown primary, we evaluate the predictive power across individual cohorts (one-tailed Wilcoxon rank-sum test), displaying significant cohorts separately (colours as in h). (k) Expression of SMARCA4, meassured as the sum of all annotated transcripts per milion (TPM; y-axis), for tumours with biallelic LOF and no LOF (x-axis). Colors indicate the rate of SBS sig. 27 in each tumour, (red >0; black = 0). The difference in expression was evaluated using a non-paired Wilcoxon rank-sum test.

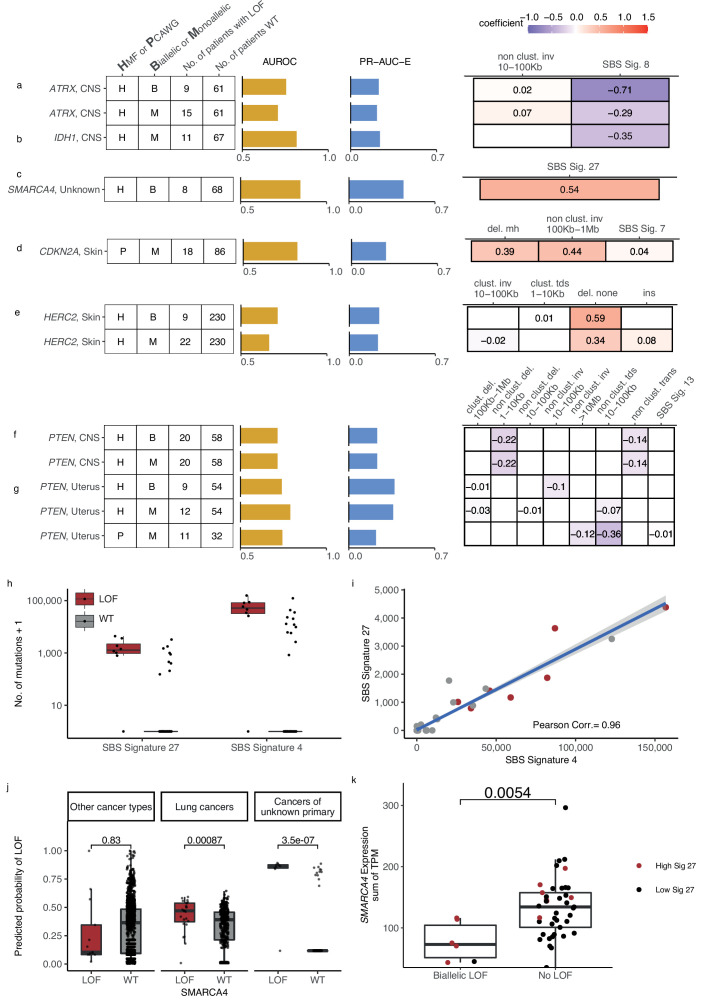
Figure 6.

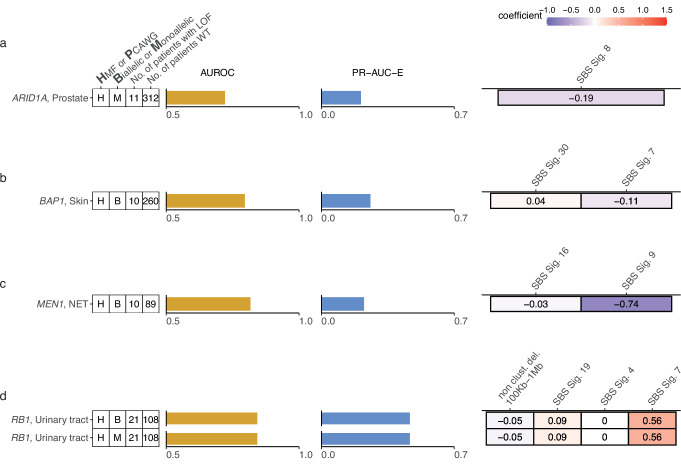
Figure 6—figure supplement 1. Additional shortlisted predictive models of DNA damage response (DDR) gene deficiencies.

Figure 6—figure supplement 1.

(a) Predictive model of ARID1A-deficiency (-d) with precision-recall area-under-the-curve enrichment from the baseline (baseline – rate of loss-of-function [LOF] in the data set; PR-AUC-E) and area-under-the-ROC curve (AUROC), as well as feature coefficients. Same info for predictive models of (b) BAP1-d, (c) MEN1-d, and (d) RB1-d.
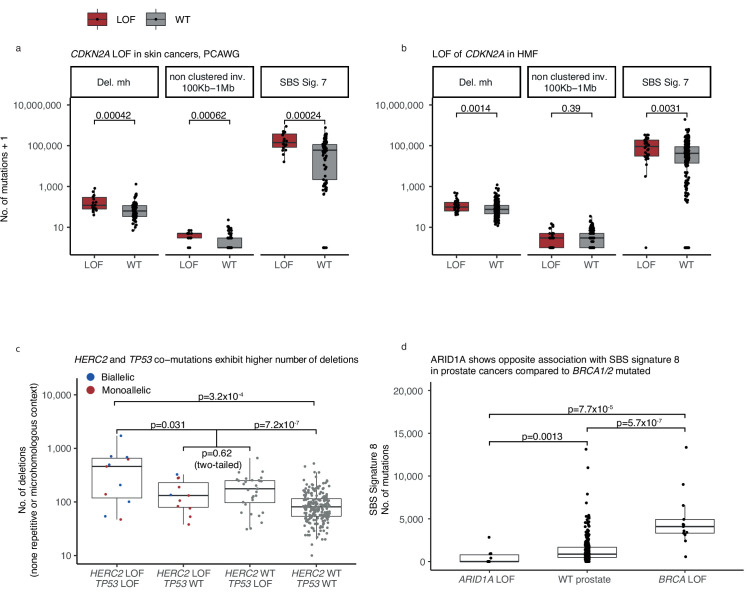
Figure 6—figure supplement 2. Monoallelic CDKN2A deficiency (-d) in The Pan-Cancer Analysis of Whole Genomes (PCAWG) and Hartwig Medical Foundation (HMF) skin cancers, mono- and biallelic HERC2 deficiency in HMF skin cancers.

Figure 6—figure supplement 2.

(a) CDKN2A monoallelic loss-of-function (LOF) cancers (red) and wild-type (grey) compared by the number of mutations (y-axis; logarithmic) across patients from the PCAWG and (b) the HMF data set (Wilcoxon rank-sum test, one-tailed). (c) Number of deletions in HMF skin cancers, HERC2-d (biallelic LOF red; monoallelic blue) and monoallelic TP53-d compared to patients with LOF of either gene (Wilcoxon test, one-tailed), and to patients with LOF in neither gene (Wilcoxon test, one-tailed). Patients with monoallelic LOF of either TP53 or HERC2 are compared (Wilcox. test two-tailed). Comparison of patients with LOF of both genes and patients with exclusively TP53 LOF (not included; Wilcoxon test, one-tailed p = 0.049). (d) Number of single-base substitution (SBS) sig. 8 mutations in ARID1A-d prostate cancers, ARID1A wild-type cancers, and BRCA1/2-d prostate cancers (Wilcoxon test, one-tailed).