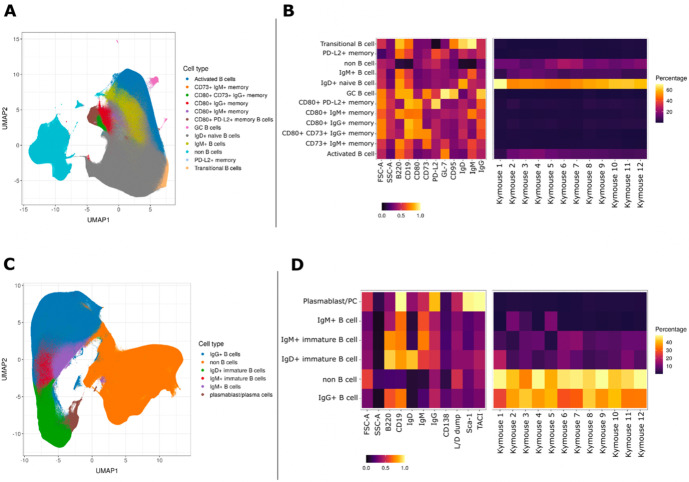
Figure 1. UMAP projections of sorted cell populations from the spleen, lymph nodes and bone marrow of Kymice.
UMAP projections of sorted cell populations identified using unsupervised clustering from spleen and lymph nodes (A) or from bone marrow samples (C) can be used to visualise marker expression on the combined cells that were used for sorting and to characterise their phenotypes. UMAP projections show a clear separation between B cells and non-B cells for both sample types. The projections are coloured by the 12 resolved cell types in the spleen and lymph nodes (A) and the six resolved in the bone marrow samples (C). Normalised and scaled marker expression and frequencies were used to visualise mouse-to-mouse variation for each of the resolved cell types in the spleen and lymph nodes (B) or the bone marrow samples (D). The expression profiles are homogeneous across mice. In spleens and lymph nodes non-class-switched IgD+ naive B cells were the predominant cell population, followed by non-B cells and IgM+ naive B cells, reflective of a tissue that has not been exposed to antigen. In bone marrow samples on the other hand the most numerous populations were non-B cells, followed closely by class-switched IgG+ B cells, a result that reflects a tissue niche that supports survival of long-lived antibody producing cells.

