. 2023 Mar 27;12:e81743. doi: 10.7554/eLife.81743

Figure 2. Escape mutant generation and mutagenesis mapping indicate critical binding residues for hantavirus mAbs.

(a) Results from viral escape selection for indicated antibodies. Real-time cellular analysis escape mutant mapping shows the number of replicates with escape over the total number of replicates for each selection mAb against the indicated selection virus. Mutations from serial passaging were identified for each mAb, and escape was confirmed in the presence of saturating mAb concentrations. VSV/ANDV or VSV/SNV were used for escape selections. (b) Side and top view of escape mutants mapped to the ANDV Gn/Gc spike (PDB: 6ZJM). The colored spheres designate escape mutants for the indicated antibody. Gn is shown in white, and Gc is shown in grey. (c) Heatmap of mAb binding in the presence of ANDV mutant constructs. Dark blue boxes indicate loss of binding. The black boxes designate escape mutants for the indicated antibody. The percent binding (% WT) of each mAb to the mutant constructs was compared to the WT SNV or ANDV control. The data are shown as average values from three to four independent experiments. All numbering for ANDV sequences was based on GenBank AF291703.2 and SNV sequences were based on GenBank KF537002.1. (d) Heatmap of SNV mutant constructs as described in c. All numbering for SNV sequences were based on GenBank KF537002.1.

Figure 2—source data 1. Percent mAb binding in the presence of ANDV mutants.
Figure 2—source data 2. Percent mAb binding the presence of SNV mutants.

Figure 2.

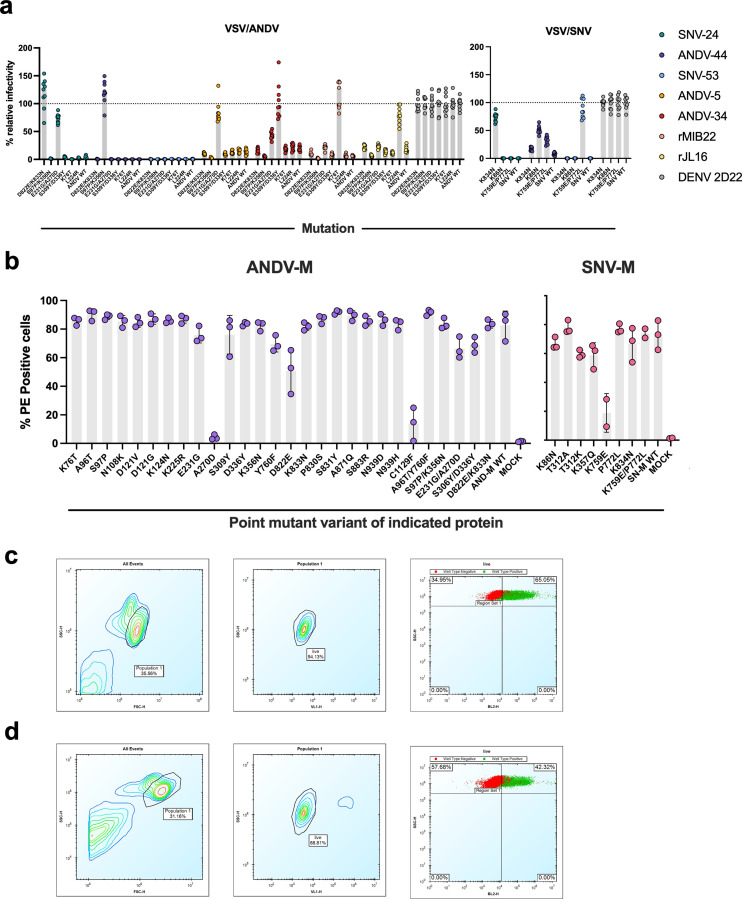
Figure 2—figure supplement 1. Mutagenesis expression levels and gating strategy.

Figure 2—figure supplement 1.

(a) Neutralization of escape mutant viruses to antibodies at a saturating concentration (10 µg/mL). The data shown are averages ± SD from three experiments, n=9. (b) Expression levels of Gn/Gc point mutants were measured based on binding of a positive control oligoclonal mix of antibodies targeting multiple epitopes on the Gn/Gc antigens. The value for % PE + cells was determined by gating on untransfected Expi293F cells (mock). The data are shown as average values from two to three independent experiments. (c) Gating strategy for antibody binding to Expi293F cells expressing ANDV M-segment. Cells were first gated by forward and side scatter and dead cells were excluded using a viability dye (DAPI). Binding of the positive control sample (oligoclonal mix of hantavirus-reactive antibodies), shown in green, was detected with a PE-conjugated goat anti-human IgG secondary. The gate for the glycoprotein-specific subset (PE+) was placed based on staining of untransfected Expi293F cells, shown in red. (d) Gating strategy for antibody binding to Expi293F cells expressing SNV M-segment, as described above in (c).
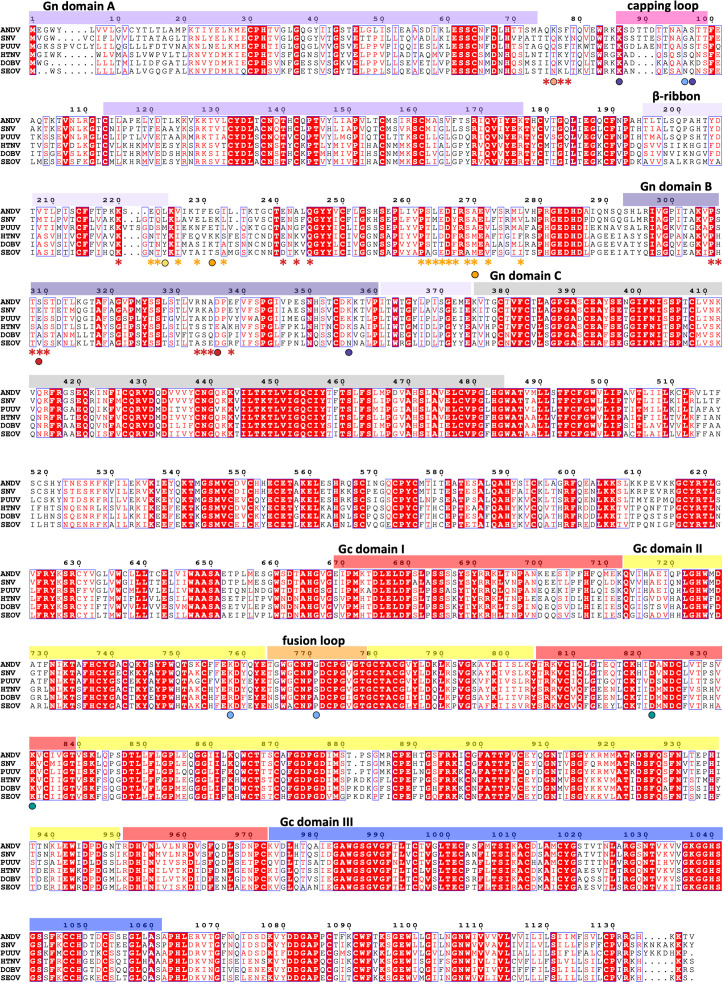
Figure 2—figure supplement 2. Amino acid alignment of hantavirus species.

Figure 2—figure supplement 2.

Multiple sequence alignment of the M-segment from six representative Orthohantaviruses. Domains are colored as followed, Gn domain A: purple, domain B: dark purple, β-ribbon domain: light purple, insertions in white, capping loop: pink; Gn domain C in grey. Gc: domain I: red, domain II: yellow, domain III: dark blue, fusion loop: orange. Strictly conserved residues are highlighted in a red background, and similar residues are colored red. Escape mutations are indicated by colored spheres; SNV-53: light blue, SNV-24: green, ANDV-44: indigo, ANDV-5: orange, rJL16: yellow, ANDV-34: red, rMIB22: salmon. Contact residues for ANDV-5 and ANDV-34 are indicated by orange or red asterisks, respectively. Sequences were aligned from Andes virus (ANDV, NC_003467.2), Sin Nombre virus (SNV, L37903.1), Puumala virus, (PUUV, KJ994777.1), Hantaan virus (HTNV, JQ083394.1), Dobrava-Belgrade virus (DOBV, JF920149.1), and Seoul virus (SEOV, NC_005237.1). Figure was generated using ESprit 3.0 (Robert and Gouet, 2014).