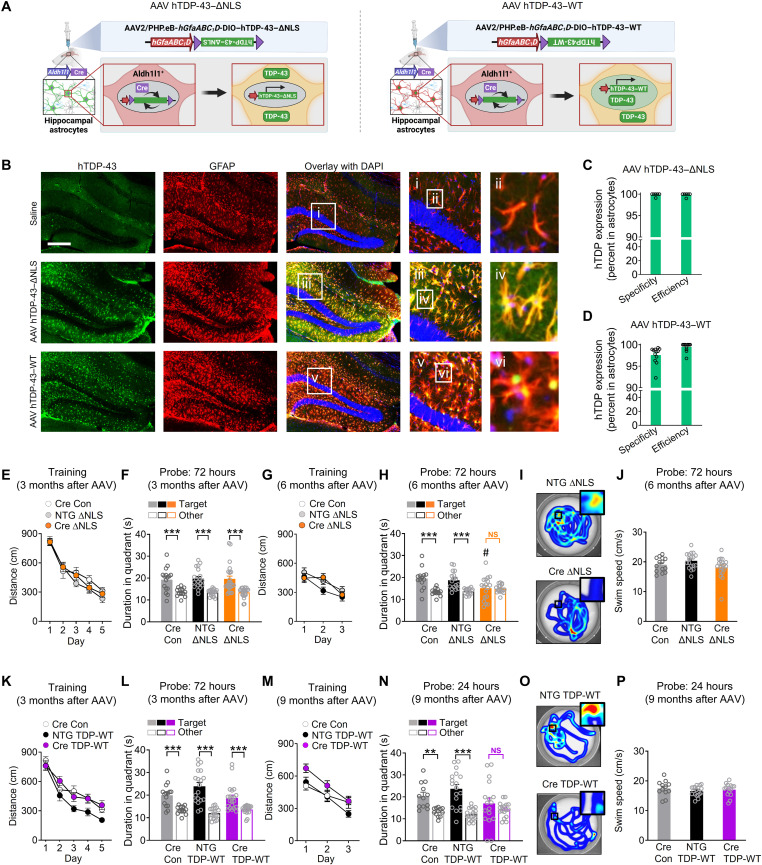
Fig. 3. Hippocampus-targeted astrocytic TDP-43 alterations are sufficient to cause progressive memory loss.
(A) Schematic of AAV-mediated transgene expression. (B) hTDP-43 (green) and astrocytic marker GFAP (red). DAPI (blue) was used to visualize nuclei. Yellow indicates overlay of green and red channels. Insets i to vi show magnified views. Scale bar, 300 μm. (C to D) hTDP-43 expression. Specificity was defined as a percent of hTDP-43–immunoreactive cells in CA1 and dentate gyrus regions that were also GFAP-positive; efficiency was a percent of GFAP-immunoreactive cells that were also hTDP-43–positive. (E to J) Aldh1l1-Cre (Cre) or NTG mice were injected at 2 to 3 months of age and tested in the Morris water maze at 3 or 6 months after injection. (E and G) Distance traveled during hidden platform training. Repeated-measures two-way ANOVA: (E) F(8,224) = 0.84, P = 0.57 for interaction and (G) F(4,96) = 1.17, P = 0.33 for interaction. (F and H) Probe trials. Durations in target and nontarget (other) quadrants. (H) One-way ANOVA (target): F(2,46) = 4.18, P = 0.016; Dunnett’s post hoc test: #P < 0.05 versus Aldh1l1-Cre/control target. Student’s t test with Welch’s correction: ***P < 0.001 versus other. (I) Swim paths during the 72-hour probe; insets show magnified views of the target platform area. (K to P) Aldh1l1-Cre or NTG mice were injected at 2 to 3 months of age and tested in the Morris water maze at 3 or 9 months after injection. (K and M) Distance traveled during training. Repeated-measures two-way ANOVA: (K) F(8,216) = 0.99, P = 0.44 for interaction and F(2,54) = 7.19, P = 0.0017 for group; (M) F(4,88) = 1.06, P = 0.38 for interaction and F(2,44) = 5.06, P = 0.0105 for group. (L and N) Probe trials. Durations in target and nontarget (other) quadrants. Student’s t test with Welch’s correction: **P < 0.01 and ***P < 0.001 versus other. (O) Swim paths during the 24-hour probe trial. (J and P) Swim speeds during indicated probe trials.

