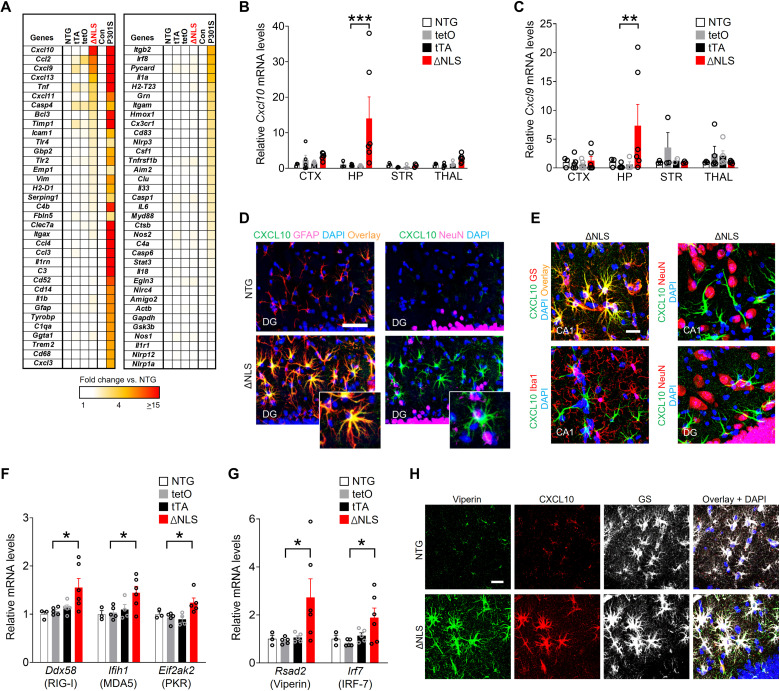
Fig. 4. Astrocytic TDP-43 alterations increase hippocampal IFN-inducible chemokines and other antiviral response factors.
(A) Hippocampal RNA levels for indicated genes in 11-month-old littermate NTG controls, single transgenic hGFAP-tTA (tTA) and tetO–hTDP-43–ΔNLS (tetO) controls, and double transgenic hTDP-43–ΔNLS mice (ΔNLS). Transgenic tau-P301S mice (P301S) and their littermate controls at 10 months of age were used for validation and comparison of gene expression. (B and C) RNA levels from indicated brain regions as measured by RT-qPCR. Neocortex (CTX), hippocampus (HP), striatum (STR), and thalamus (THAL). Two-way ANOVA: F(9,52) = 2.06, P = 0.051 for interaction and F(3,52) = 3.061, P = 0.019 for genotype (B); F(9,49) = 1.65, P = 0.13 for interaction and F(3,49) = 0.85, P = 0.47 for genotype (C); Dunnett’s post hoc test: **P < 0.01 and ***P < 0.001 versus tetO. (D and E) CXCL10 immunoreactivity (green) in the dentate gyrus molecular layer and CA1 of 11-month-old NTG and ΔNLS mice. Astrocyte markers GFAP or glutamine synthetase (GS), neuronal marker NeuN, or microglial/macrophage marker Iba1, as indicated. Yellow indicates overlay of green and red channels. DAPI (blue) was used to visualize nuclei. Insets in (D) show magnified views. Scale bars, 100 μm (D) and 20 μm (E). (F and G) Hippocampal RNA levels in 11-month-old NTG controls, single transgenic tetO and tTA controls, and ΔNLS mice. One-way ANOVA: F(3,15) = 4.19, P = 0.024 (Ddx58); F(3,14) = 4.02, P = 0.029 (Ifih1); F(3,13) = 5.097, P = 0.015 (Eif2ak2); F(3,15) = 3.38, P = 0.046 (Rsad2); and F(3,15) = 3.29, P = 0.049 (Irf7). Dunnett’s post hoc test: *P < 0.05 versus tetO. (H) Viperin (green), CXCL10 (red), and glutamine synthetase (white) immunoreactivity in the dentate gyrus of 11-month-old NTG and ΔNLS mice. Scale bar, 20 μm.

