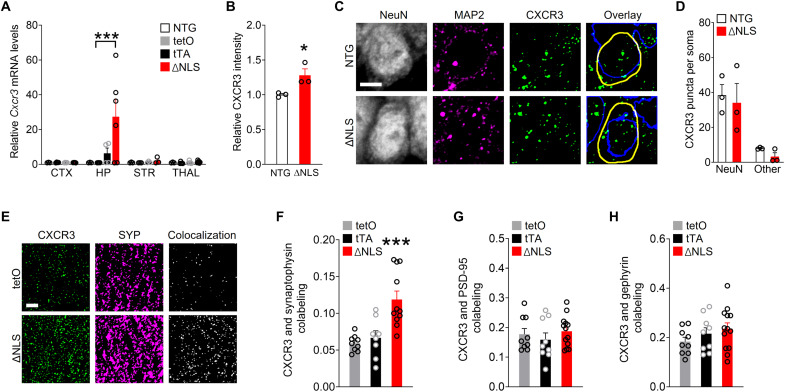
Fig. 7. Astrocytic TDP-43 alterations increase chemokine receptor CXCR3 levels in presynaptic terminals.
(A) Cxcr3 RNA levels from indicated brain regions of NTG, single transgenic controls (tetO and tTA), and double transgenic ΔNLS mice. Neocortex, hippocampus, striatum, and thalamus. Two-way ANOVA: F(9,48) = 2.89, P = 0.0081 for interaction and F(3,48) = 2.93, P = 0.043 for genotype; Dunnett’s post hoc test: ***P < 0.001 versus tetO. (B and D) Images [C Microtubule-associated protein 2(MAP 2)] and quantification (B and D) of hippocampal immunoreactivity for CXCR3 in the CA1 radiatum parenchyma (B) or specifically in CA1 neuronal cell bodies (C and D) as delineated by coimmunolabeling with neuronal marker NeuN versus non-NeuN regions in NTG and ΔNLS mice. Neuronal nuclei are indicated by blue traces; cell somas are indicated by yellow traces. Arbitrary fluorescence intensity units were normalized to NTG mice (B). Student’s t test: *P = 0.039. (E and F) Colocalization of CXCR3 and the presynaptic marker synaptophysin in the CA1 region of single transgenic controls and ΔNLS mice. Mander’s overlap coefficient was used to assess colocalization. One-way ANOVA: F(2,25) = 12.94, P < 0.0001; Dunnett’s post hoc test: ***P < 0.001 versus tetO. (G and H) Colocalization of CXCR3 and the postsynaptic markers PSD-95 (G) or gephyrin (H) in the CA1 region of single transgenic controls and double transgenic ΔNLS mice. Mander’s overlap coefficient was used to assess colocalization. Scale bars, 5 μm (C, E).

