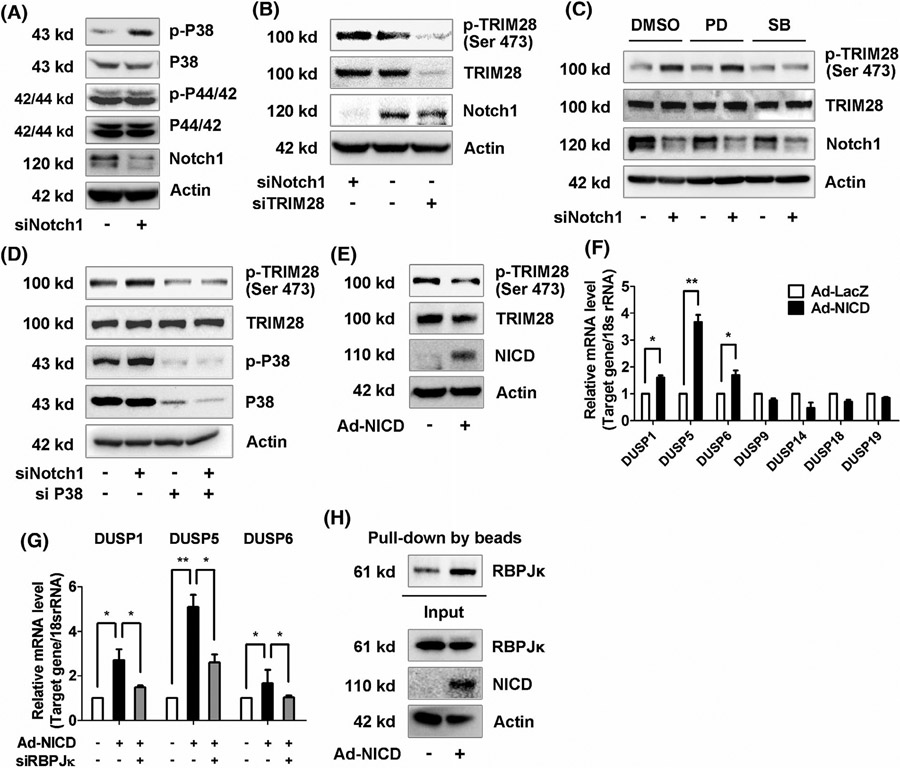
FIGURE 7.
The feedback loop between Notch1 and TRIM28 in ECs. A, ECs were transfected with scrambled or Notch1 siRNA for 48 hours. MAPK activation were analyzed using western blot. n = 3. B, The protein expressions of Notch1, phosphorylated, and total TRIM28 in Notch1 or TRIM28 knockdown ECs were analyzed using western blot. n = 3. C, The control or Notch1 knockdown ECs were incubated with DMSO, PD98059 (10 μM), or SB203580 (10 μM) for 16 hours. Cells were lysed and analyzed using western blot. n = 3. D, Phosphorylation of TRIM28 and p38 MAPK in cells transfected with Notch1 siRNA alone or Notch1 combined with p38 MAPK siRNA. n = 3. E-F,ECs were infected with Ad-GFP or Ad-NICD for 48 hours. Cell lysates were subjected to immunoblotting as indicated (E). n = 3. Expressions of DUSP family were checked using qRT-PCR assay (F). n = 3. * P < .05, **P < .01. Statistical significance was calculated referring to the biological replicates by unpaired Student’s t test. G, The control or RBPJκ knockdown ECs were infected with Ad-NICD for 48 hours. The mRNA expressions of DUSP1, DUSP5, and DUSP6 were analyzed using qRT-PCR method. n = 3. * P < .05, ** P < .01. Statistical significance was calculated by Tukey’s multiple comparison test. H, Nuclear extracts were isolated from Ad-GFP or Ad-NICD infected ECs and subjected to in vitro DNA-binding affinity assay. n = 3

