
Figure 4 —
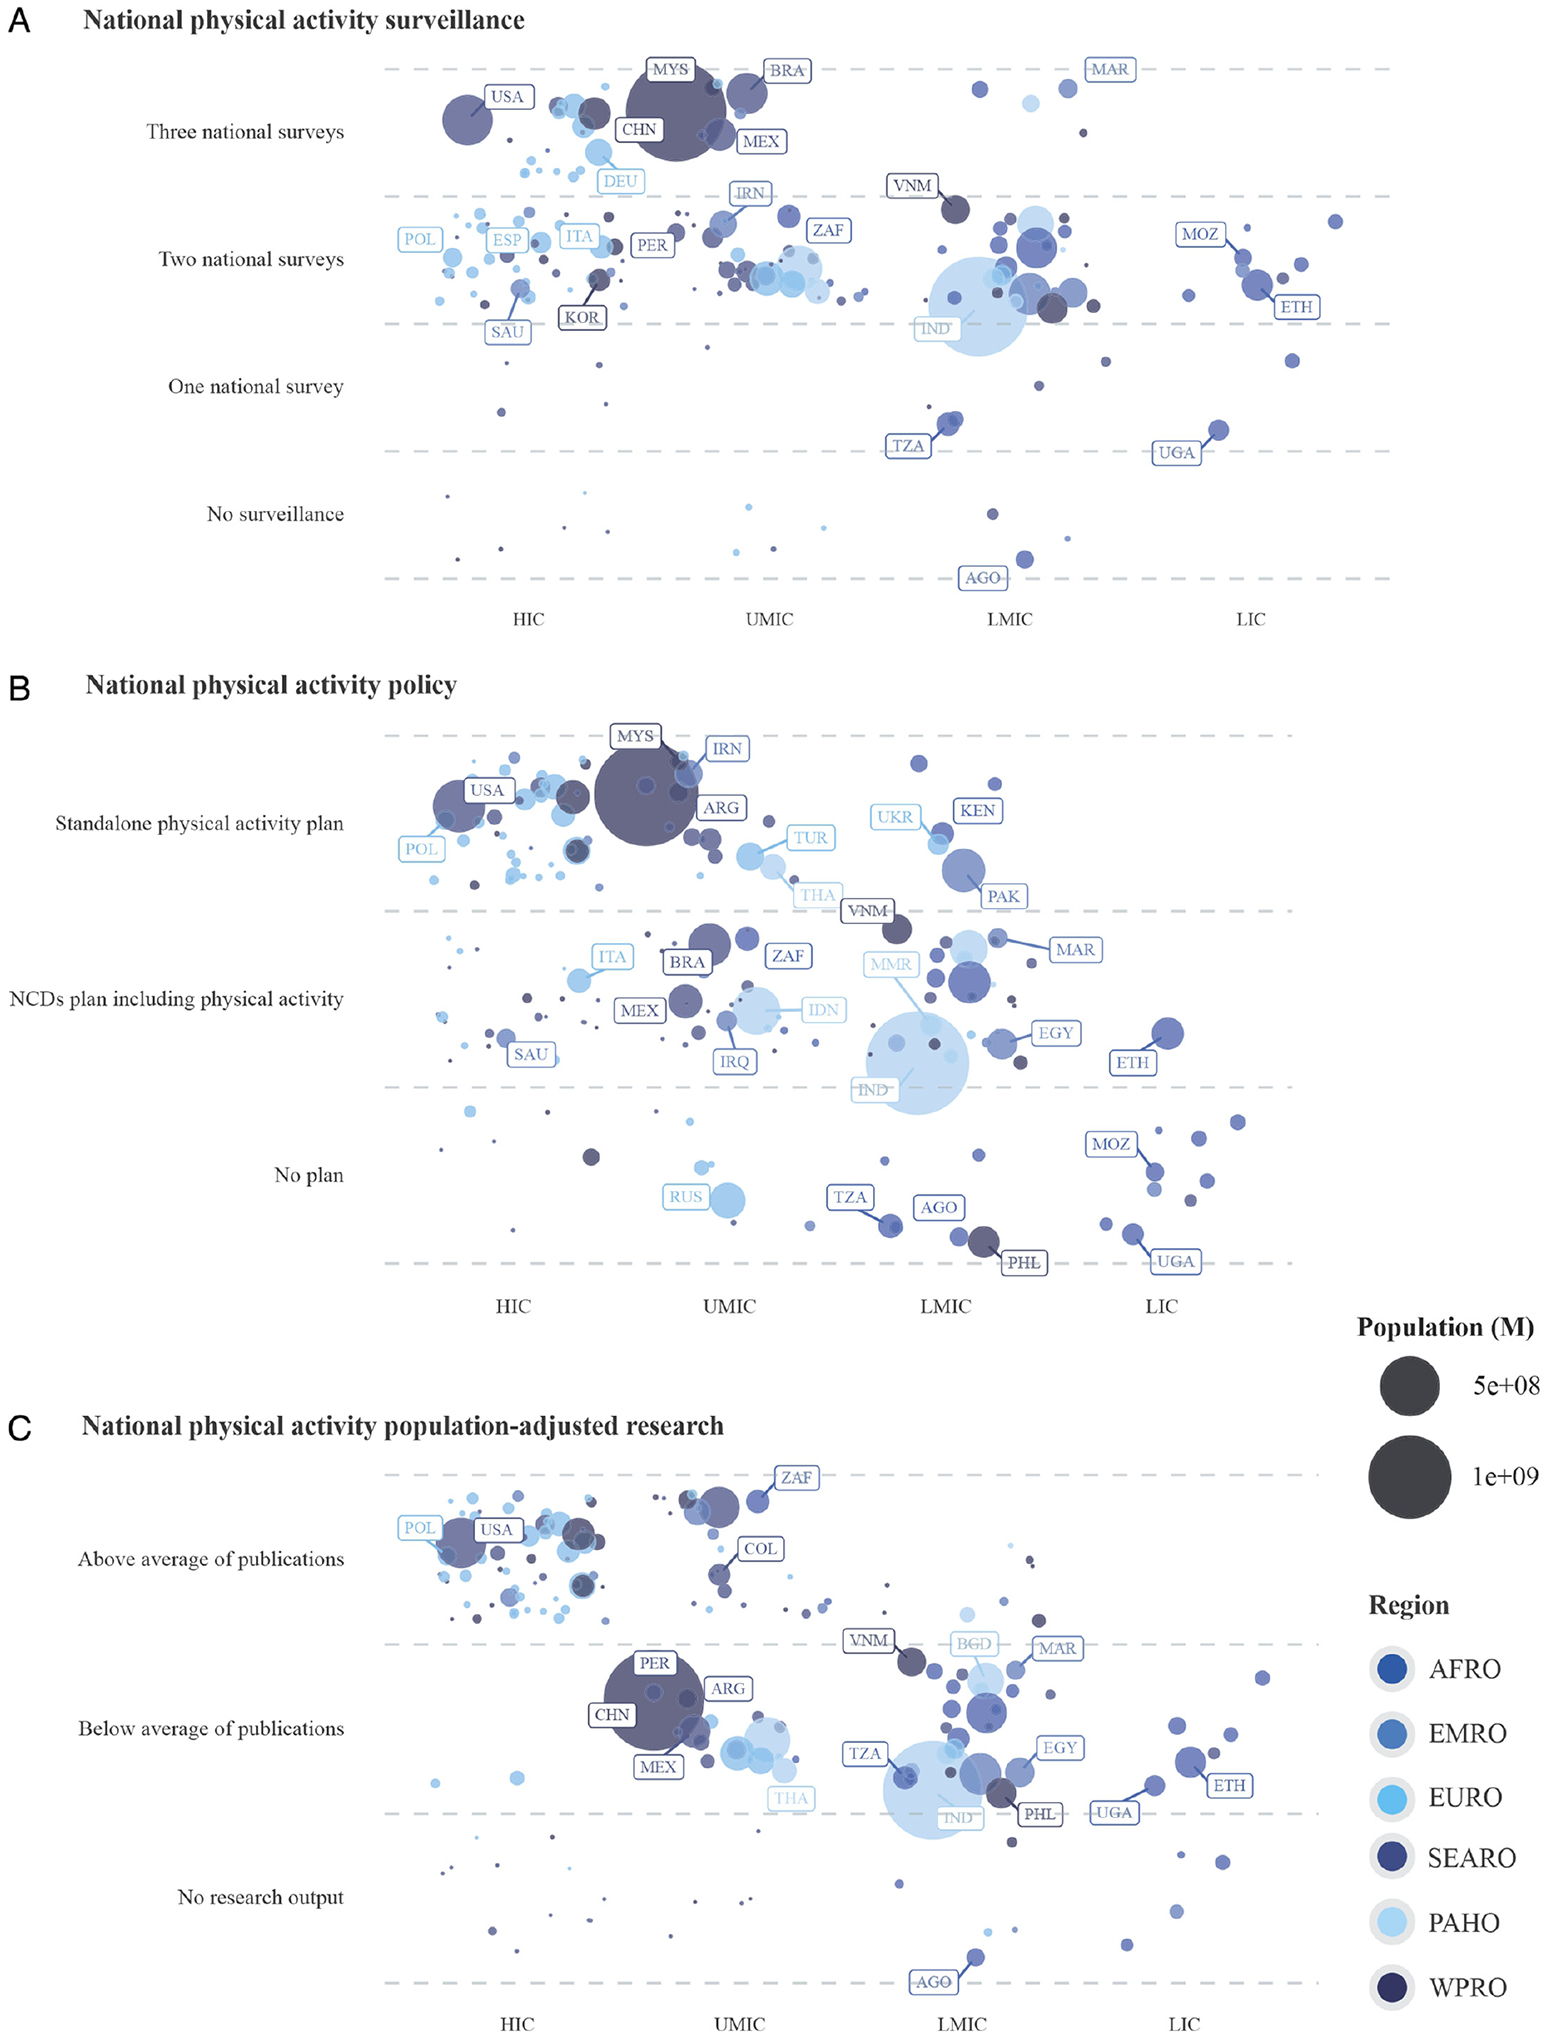
Global physical activity surveillance, policy, and research: GoPA! categories by country population, income, and region.
Note: Random noise was added to minimize countries’ overplotting according to H. Wickham22 with the countries maintaining their position based on the indicator and income group. For example, POL and ITA both have 2 national surveys (upper left) and are high-income countries; the random noise prevents them from overlapping but keeps them in their respective positions inside the cell, as determined by the indicator and their respective income group classification. AFRO indicates Africa; ARG, Argentina; BGD, Bangladesh; BRA, Brazil; CHN, China; COL, Colombia; EGY, Egypt, Arab Rep.; EMRO, Eastern Mediterranean; ESP, Spain; EURO, Europe; ETH, Ethiopia; DEU, Germany; GoPA!, Global Observatory for Physical Activity; HIC, high-income country; IND, India; IDN, Indonesia; IRN, Iran, Islamic Rep.; IRQ, Iraq; ITA, Italy; KEN, Kenya; KOR, Korea, Rep.; LIC, low-income country; LMIC, lower-middle-income country; MYS, Malaysia; MEX, Mexico; MAR, Morocco; MOZ, Mozambique; MMR, Myanmar; PAHO, The Americas; PAK, Pakistan; PER, Peru; PHL, Philippines; POL, Poland; RUS, Russian Federation; SEARO, South-East Asia; SAU, Saudi Arabia; TZA, Tanzania; THA, Thailand; TUR, Turkey; UGA, Uganda; UKR, Ukraine; UMIC, upper-middle-income country; USA, United States; VNM, Vietnam; WPRO, Western Pacific; ZAF, South Africa. Note: The regions from lightest to darkest on the color scale are: PAHO, EURO, EMRO, AFRO, SEARO, and WPRO. For the most accurate interpretation of this graph (full range of color) please refer to the electronic version of the manuscript.